Author: mdierolf

  • CF Industries (NYSE: CF): From Fertilizer Giant to Low-Carbon Energy Leader

    CF Industries (NYSE: CF): From Fertilizer Giant to Low-Carbon Energy Leader

    Date: April 13, 2026

    Introduction

    CF Industries Holdings, Inc. (NYSE: CF) has undergone a profound transformation, evolving from a traditional agricultural supplier into a cornerstone of the emerging global low-carbon energy economy. As of mid-April 2026, the company stands as the world’s largest producer of ammonia, but its current market focus extends far beyond the corn belt. By leveraging its massive manufacturing footprint and the logistical advantages of the U.S. Gulf Coast, CF has positioned itself as a primary beneficiary of the global shift toward decarbonization. With the successful launch of its landmark carbon capture projects and a strategic leadership transition now in the rearview mirror, CF is increasingly viewed by investors not just as a fertilizer play, but as a high-margin industrial technology and clean-energy infrastructure giant.

    Historical Background

    The story of CF Industries began in 1946 as the Central Farmers Fertilizer Company, a cooperative established to provide regional farmers with a reliable supply of plant nutrients. For decades, it operated under a member-owned model until its pivotal 2005 Initial Public Offering (IPO) on the New York Stock Exchange.

    The post-IPO era was defined by aggressive consolidation and scale. The 2010 acquisition of Terra Industries for $4.7 billion fundamentally shifted the company’s trajectory, doubling its size and establishing its dominance in North American nitrogen production. Over the following decade, CF focused on optimizing its "cost-leadership" model, capitalizing on the shale gas revolution which provided a permanent cost advantage over European and Asian competitors. Most recently, the 2023 acquisition of the Waggaman ammonia complex in Louisiana for $1.675 billion further cemented its position as the undisputed leader in domestic ammonia production and set the stage for its current focus on "blue" (low-carbon) ammonia.

    Business Model

    CF Industries operates an integrated manufacturing model centered on the production of nitrogen-based products. Natural gas, which serves as both the fuel and the feedstock, typically accounts for 70% to 80% of production costs. The company’s core business model is built around the nitrogen "value chain":

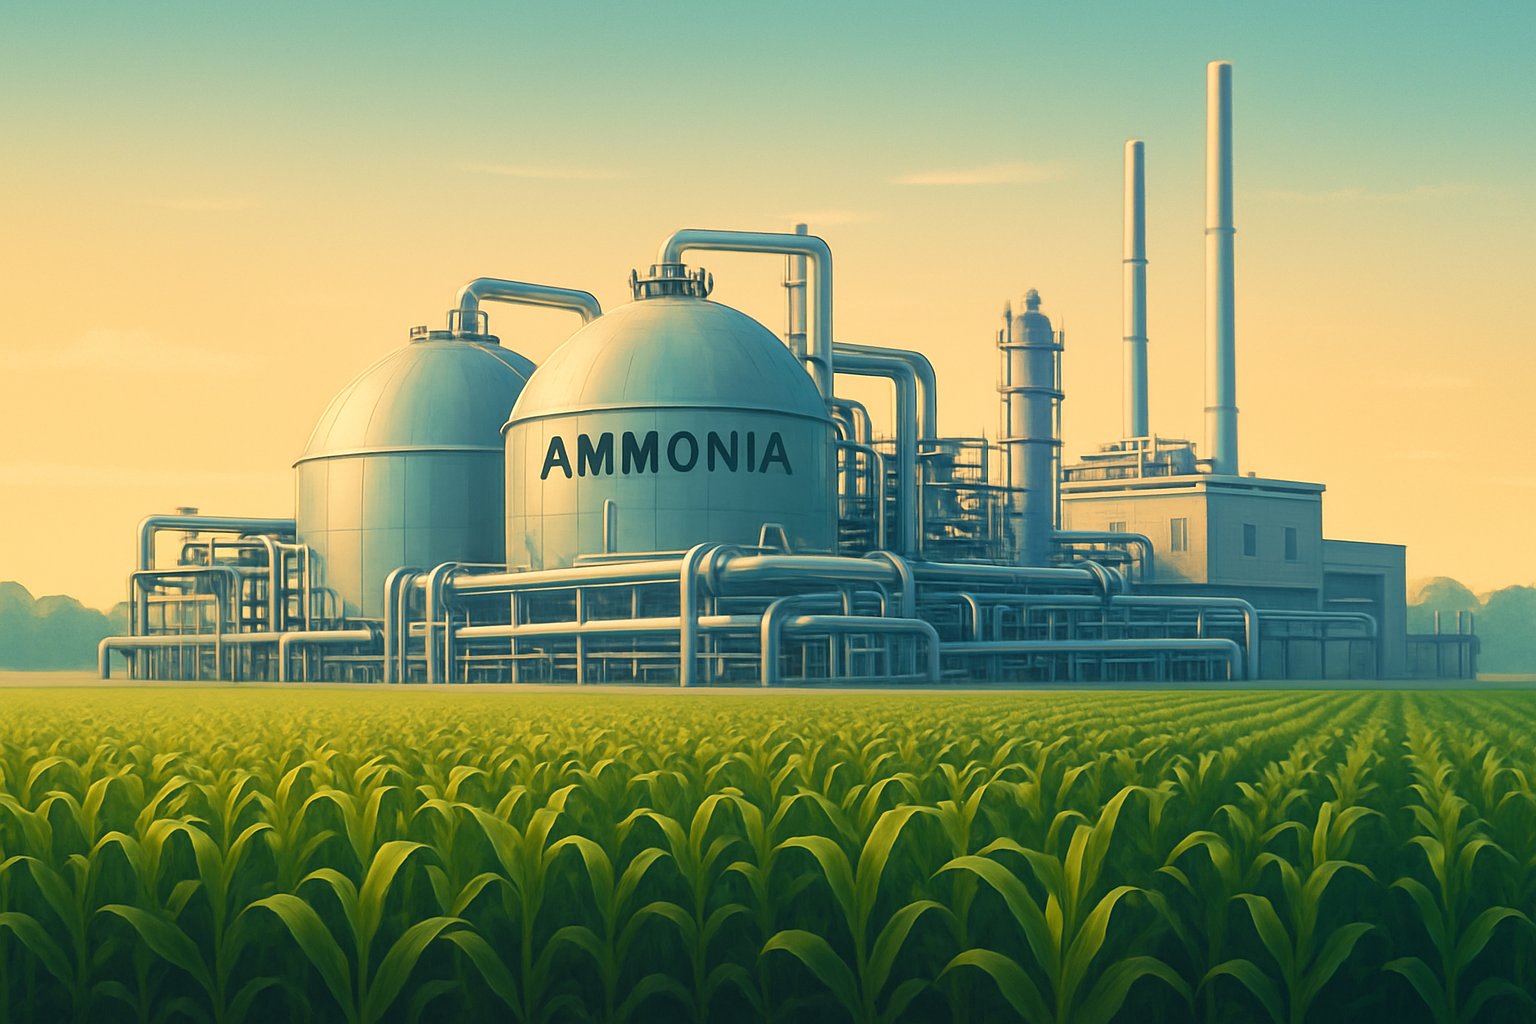
    • Ammonia: The foundation for all nitrogen products. While much of it is used directly as fertilizer or upgraded into other forms, CF is increasingly marketing ammonia as a zero-carbon fuel for the maritime and power generation sectors.
    • Granular Urea: A solid fertilizer with high nitrogen content, favored in global trade due to its ease of transport.
    • Urea Ammonium Nitrate (UAN): A liquid fertilizer highly popular in North America for its precision application capabilities.
    • Ammonium Nitrate (AN): Used in specialized agriculture and the industrial explosives industry.
    • Industrial & Other: Includes Diesel Exhaust Fluid (DEF) and nitric acid, providing a non-agricultural revenue stream that mitigates seasonal volatility.

    The company’s competitive moat is its distribution network—a massive system of pipelines, barges, and storage terminals that allows it to move product from the low-cost U.S. Gulf Coast to the high-demand regions of the Midwest and international markets with unmatched efficiency.

    Stock Performance Overview

    Over the past decade, CF has been a standout performer in the basic materials sector.

    • 10-Year View: Investors have benefited from a disciplined capital allocation strategy. Since 2020, the company has reduced its shares outstanding by approximately 24%, driving significant earnings-per-share (EPS) growth even during periods of price volatility.
    • 5-Year View: The stock has seen a meteoric rise, up roughly 164% since early 2021. This was initially driven by the post-pandemic commodity boom and later by the market’s realization of CF’s potential in the clean energy space.
    • 1-Year View: As of April 13, 2026, the stock is trading near $121, up 73% over the last twelve months. This recent surge reflects the successful commercialization of the Donaldsonville carbon capture project and the initial recognition of 45Q tax credits on the balance sheet.

    Financial Performance

    CF’s recent financial results underscore a high-margin business benefiting from global supply constraints.

    • Revenue and Income: Following a robust 2025 which saw revenue hit $7.08 billion and net income reach $1.46 billion, the company entered 2026 with strong momentum.
    • Margins: Operating margins remain industry-leading, frequently exceeding 30% due to the widening "gas spread"—the difference between low-cost U.S. natural gas prices and higher global benchmarks.
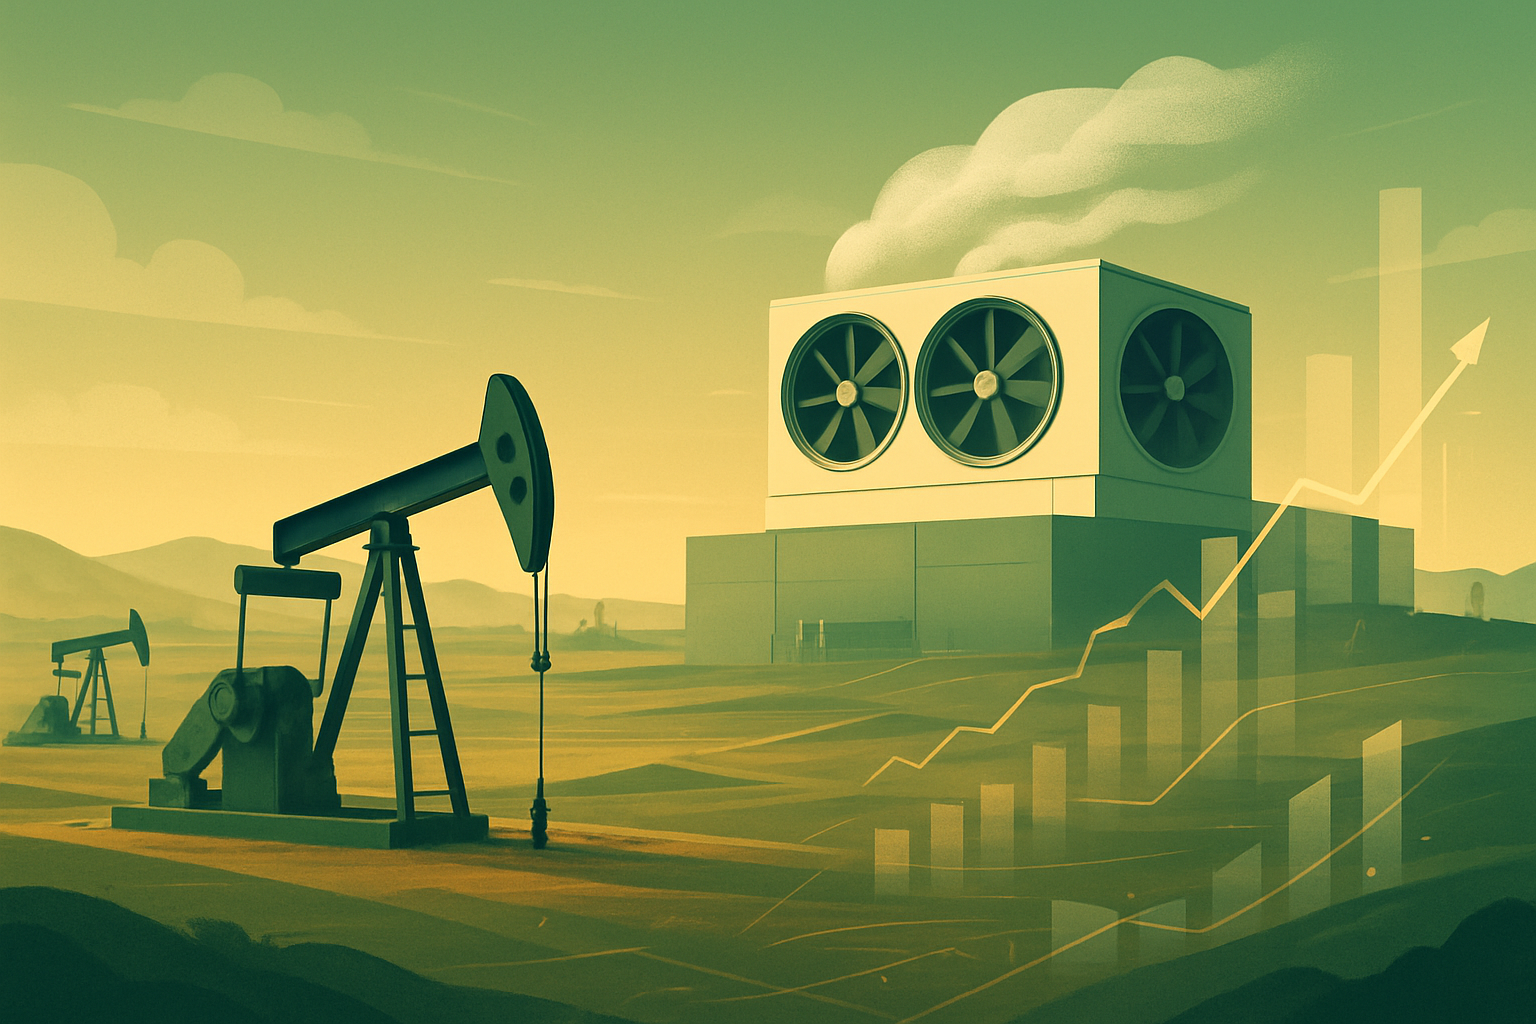
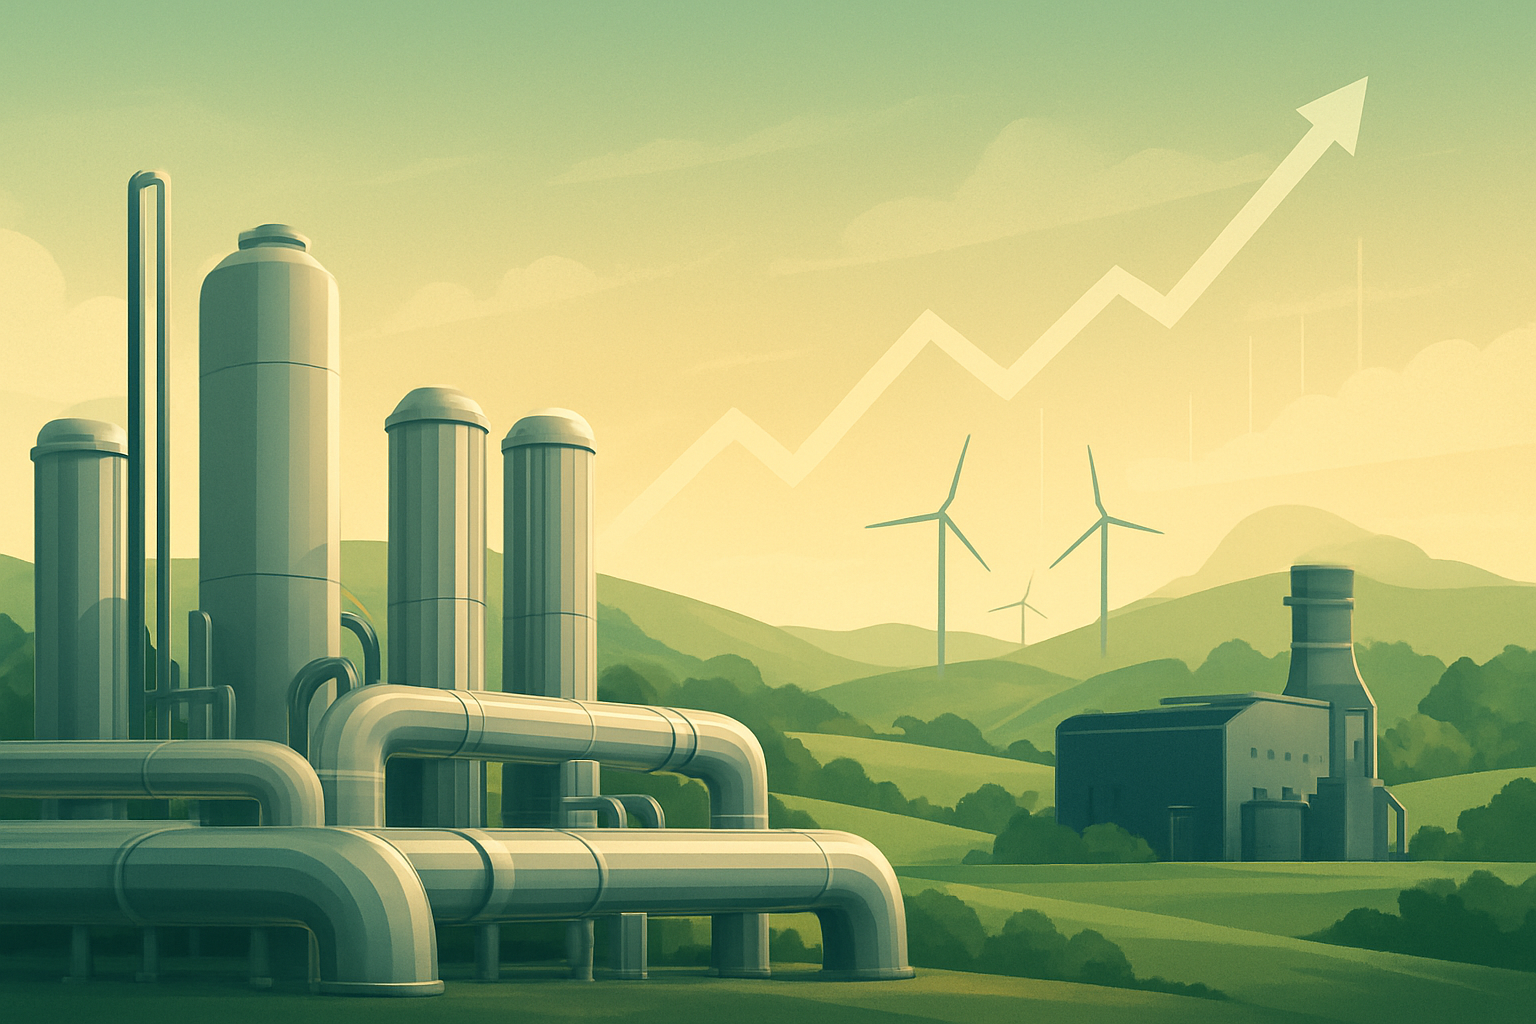
    • The 45Q Impact: A critical new component of CF’s financials is the Section 45Q tax credit. By sequestering 2 million metric tons of CO2 annually at its Donaldsonville site, the company is accruing roughly $170 million in annual EBITDA tailwinds, a figure that is expected to grow as more CCS (Carbon Capture and Sequestration) projects come online.
    • Balance Sheet: The company maintains a conservative leverage profile, with a Net Debt to EBITDA ratio consistently below 1.5x, providing ample dry powder for its $4 billion "Blue Point" expansion.

    Leadership and Management

    January 2026 marked the beginning of a new era for CF Industries. Christopher D. Bohn assumed the role of President and CEO, succeeding the legendary Tony Will, who retired after a 12-year tenure. Bohn, who previously served as COO and CFO, is widely seen as the architect of the company’s operational efficiency and its clean-energy pivot.

    The leadership transition has been viewed favorably by the market, as Bohn represents continuity in the company's "cash-cow" agricultural business while bringing a technocratic focus to the execution of the low-carbon ammonia strategy. The board remains highly regarded for its shareholder-friendly policies, particularly its commitment to returning excess cash through dividends and buybacks.

    Products, Services, and Innovations

    The most significant innovation in CF’s portfolio is its Blue Ammonia offering. Produced by capturing the CO2 byproduct during the traditional Haber-Bosch process, blue ammonia allows CF to serve markets that are mandate-bound to reduce carbon footprints.

    In late 2025, CF and ExxonMobil (NYSE: XOM) operationalized the world's largest commercial-scale CO2 dehydration and compression facility. Furthermore, CF has abandoned its pursuit of small-scale "green" (electrolysis-based) ammonia in favor of the more economically viable blue ammonia, which leverages existing infrastructure and the generous U.S. regulatory environment.

    Competitive Landscape

    CF operates in a concentrated global market, but its primary competition has shifted:

    • Nutrien Ltd. (NYSE: NTR): The primary North American competitor. Nutrien’s strength lies in its massive retail footprint and potash assets. However, CF currently commands a higher valuation multiple due to its "pure-play" nitrogen focus and more advanced carbon-capture integration.
    • Yara International (OTC: YARIY): A global leader based in Norway. While Yara has been a pioneer in green ammonia, its reliance on expensive European natural gas has put it at a perennial cost disadvantage compared to CF’s Gulf Coast operations.
    • Middle Eastern & Russian Producers: While these regions have low gas costs, CF’s proximity to the U.S. market and its "certified low-carbon" status provide a shield against cheap, high-carbon imports.

    Industry and Market Trends

    The nitrogen industry in 2026 is defined by two divergent trends. In the short term, global supply remains tight due to ongoing geopolitical instability and the closure of high-cost capacity in Europe. In the long term, the industry is transitioning toward an energy carrier model.

    Ammonia is increasingly recognized as a superior hydrogen carrier because it is easier to liquefy and transport than pure hydrogen. Shipping companies and Japanese power utilities are currently the largest emerging customer segments, seeking ammonia to co-fire in coal plants or as a direct carbon-free maritime fuel.

    Risks and Challenges

    Despite its strong position, CF faces several structural risks:

    • Feedstock Volatility: While U.S. gas is currently cheap, any significant increase in domestic natural gas prices would squeeze margins.
    • Operational Risks: The carbon capture projects involve complex, high-pressure infrastructure. Any technical failure or leak could lead to significant regulatory fines and reputational damage.
    • Cyclicality: Agriculture remains the primary driver of demand. A downturn in corn prices or a shift in farmer planting intentions could lead to a glut in nitrogen supply.
    • Policy Reversal: Much of the current valuation is tied to the Inflation Reduction Act (IRA). A change in the U.S. political administration that leads to a repeal or reduction of 45Q credits remains a primary concern for institutional investors.

    Opportunities and Catalysts

    • Blue Point JV: The $4 billion joint venture with Mitsui & Co. and JERA is a massive catalyst. This facility is designed specifically for the export market, targeting long-term supply contracts with Asian utilities.
    • Green Premium: As the European Union’s Carbon Border Adjustment Mechanism (CBAM) takes full effect, CF’s low-carbon ammonia will likely command a "green premium" price, further boosting margins on exports.
    • M&A: With a strong balance sheet, CF is well-positioned to acquire smaller nitrogen assets or midstream CO2 infrastructure to further vertical integration.

    Investor Sentiment and Analyst Coverage

    Investor sentiment on CF is currently "Bullish," with a heavy focus on its ESG (Environmental, Social, and Governance) transformation. Wall Street analysts have largely shifted their classification of CF from a "Cyclical Ag" stock to an "Energy Transition" stock, which has historically commanded higher P/E multiples.

    Major institutional holders, including BlackRock and Vanguard, have maintained or increased their positions, citing the company's clear path to carbon neutrality and its disciplined return of capital. Retail sentiment, while more focused on the agricultural cycle, has also trended positive as the stock approaches all-time highs.

    Regulatory, Policy, and Geopolitical Factors

    The geopolitical landscape has played in CF’s favor. Energy security concerns in Europe and Asia have increased the demand for reliable, North American energy-based products.

    Regulatively, the Inflation Reduction Act remains the backbone of the company’s growth strategy. The $85 per ton credit for sequestered CO2 has effectively subsidized the company’s transition to a low-carbon leader. Furthermore, global maritime regulations (IMO 2030/2050) are providing the "pull" demand needed to justify the massive capital expenditures in new ammonia infrastructure.

    Conclusion

    CF Industries is a rare example of a legacy industrial giant successfully navigating the energy transition. By April 2026, the company has proven it can maintain its dominance in the essential agricultural fertilizer market while simultaneously building a high-growth business in low-carbon energy.

    Investors should watch for the continued execution of the Blue Point project and any shifts in U.S. climate policy. However, with its massive cost advantage, aggressive buyback program, and the significant tailwind of carbon capture credits, CF remains a compelling core holding for those seeking exposure to both food security and the global decarbonization trend.


    This content is intended for informational purposes only and is not financial advice.

  • APA Corporation (APA): Navigating the Frontier from the Permian to Suriname

    APA Corporation (APA): Navigating the Frontier from the Permian to Suriname

    As of April 13, 2026, the global energy landscape remains a study in volatility, yet few companies have navigated the turbulence with as much strategic clarity as APA Corporation (Nasdaq: APA). Formerly known to many as Apache, APA has spent the last two years executing a rigorous "re-baselining" of its portfolio. By shedding legacy assets in the North Sea, doubling down on the U.S. Permian Basin through the transformative acquisition of Callon Petroleum, and de-risking one of the world's most significant offshore discoveries in Suriname, APA has transitioned from a high-beta wildcatter into a disciplined, cash-flow-focused independent producer. This report examines the fundamental shifts that have made APA a centerpiece of the current energy investment dialogue.

    Historical Background

    The story of APA Corporation began in 1954 in Minneapolis, where it was founded as the Apache Oil Corporation. For much of the 20th century, the company built a reputation as a savvy and aggressive acquirer of undervalued oil and gas properties. However, the modern era of APA is defined by a hard-learned lesson: the "Alpine High" discovery of 2017. Initially touted as a massive new play in the Permian, it eventually led to a multi-billion dollar write-down, forcing a radical rethink of the company's strategy.

    In 2021, the company reorganized into a holding company structure, APA Corporation, to better manage its diverse international subsidiaries. This reorganization coincided with a fundamental pivot from "production growth at any cost" to "capital discipline." Since then, the company has focused on maximizing returns from its three core "pillars": the United States, Egypt, and the emerging frontier of Suriname.

    Business Model

    APA operates a diversified upstream model that balances short-cycle shale production with long-cycle international projects. Its revenue is derived primarily from the sale of crude oil, natural gas, and natural gas liquids (NGLs).

    1. United States: Following the $4.5 billion acquisition of Callon Petroleum in 2024, the U.S. segment—specifically the Permian Basin—now accounts for approximately 55% of total production. This is the company's "cash cow," providing short-cycle flexibility and immediate cash flow.
    2. Egypt: Operated through a joint venture with Sinopec and the Egyptian General Petroleum Corporation (EGPC), Egypt provides high-margin production. A recent 2025 gas pricing agreement has revitalized this segment, turning APA into a major regional gas player.
    3. Suriname (Block 58): This is the company's long-term growth engine. Partnered with TotalEnergies (NYSE: TTE), APA is developing the "GranMorgu" project, which is expected to provide a massive inflection in cash flow by late 2028.
    4. North Sea: Once a cornerstone, this segment is currently being wound down as APA focuses on more capital-efficient regions.

    Stock Performance Overview

    Over the past decade, APA's stock performance has been a roller coaster, reflecting the broader volatility of the energy sector and internal strategic shifts.

    • 10-Year View: The stock still reflects the scars of the 2014-2016 oil price crash and the 2020 pandemic lows. However, the recovery since 2021 has been robust, driven by debt reduction and the Suriname discoveries.
    • 5-Year View: APA has significantly outperformed many of its peers as it benefited from the post-COVID energy rally and successful debt-clearing initiatives.
    • 1-Year View (2025-2026): Over the last 12 months, the stock has traded in a relatively tight range, as the market balances the immediate benefits of Permian cash flow against the heavy capital expenditure required for the Suriname development. As of today, the stock sits at a valuation that many analysts consider a discount relative to its asset base, primarily due to the "execution risk" associated with the 2028 Suriname timeline.

    Financial Performance

    APA's financial health as of April 2026 is the strongest it has been in years. In the 2025 fiscal year, the company reported a net income of $1.4 billion, a significant improvement from the impairment-heavy years of the early 2020s.

    Key metrics include:

    • Free Cash Flow (FCF): APA generated over $1.0 billion in FCF in 2025, even while integrating Callon Petroleum and funding Suriname exploration.
    • Debt Management: The company reduced net debt by 27% in 2025, nearing its long-term target of $3 billion. This deleveraging has allowed for a more aggressive shareholder return policy.
    • Shareholder Returns: APA returned approximately $640 million to shareholders in 2025 through a combination of a $1.00 per share annual dividend and tactical share buybacks.
    • Valuation: Trading at an EV/EBITDAX multiple that remains below the peer average, APA is often cited as a "value play" among large-cap independents.

    Leadership and Management

    The current leadership team is headed by CEO John J. Christmann IV, who has led the company since 2015. While Christmann's early tenure was marked by the Alpine High struggle, he is now credited with the company's successful financial turnaround and the strategic pivot toward Suriname.

    In May 2025, Ben C. Rodgers was promoted to Executive VP and CFO, signaling a continued focus on balance sheet strength and capital allocation. The management team has earned a reputation for being pragmatic; they were among the first to announce a wind-down of North Sea assets following the UK's tax hikes, a move that was initially unpopular but is now viewed as a necessary defense of shareholder capital.

    Products, Services, and Innovations

    While APA produces standard energy commodities (oil and gas), its "innovation" lies in its operational efficiency and exploration techniques.

    • Permian Drilling: The integration of Callon's assets has allowed APA to implement "simops" (simultaneous operations) and longer lateral wells, significantly reducing the cost per barrel.
    • Suriname Infrastructure: The GranMorgu project involves a massive Floating Production Storage and Offloading (FPSO) unit designed for 220,000 barrels per day. The engineering involved in this deepwater project is world-class, utilizing advanced seismic imaging to de-risk the Sapakara and Krabdagu fields.

    Competitive Landscape

    APA competes against a range of independent and major oil companies. In the Permian, its rivals include Diamondback Energy (Nasdaq: FANG) and Occidental Petroleum (NYSE: OXY). While APA lacks the sheer scale of Occidental, its diverse international footprint (Egypt and Suriname) provides a geographic hedge that many domestic-focused independents lack.

    APA’s competitive strength lies in its "first-mover" advantage in Suriname’s Block 58. While majors like ExxonMobil (NYSE: XOM) dominate neighboring Guyana, APA's 50% stake in Block 58 gives it a much higher "torque" to success in that basin than a larger major would have.

    Industry and Market Trends

    The energy sector in 2026 is defined by two competing forces: the urgent need for reliable hydrocarbons and the long-term transition toward lower-carbon energy. APA has navigated this by:

    • Consolidation: The Callon deal followed a wider industry trend of M&A in the Permian (e.g., Exxon-Pioneer, Chevron-Hess).
    • Gas Growth: Recognizing gas as a "bridge fuel," APA has leaned into its Egyptian gas assets to meet European and regional demand.
    • Supply Chain Resilience: APA has moved toward long-term service contracts to mitigate the inflationary pressures that plagued the industry in 2023-2024.

    Risks and Challenges

    Investing in APA is not without significant risks:

    • Execution Risk (Suriname): The $10.5 billion GranMorgu project is the company's "all-in" bet. Any delay in the mid-2028 first-oil target would severely impact the company's valuation.
    • Geopolitical Risk (Egypt): Operating in Egypt involves navigating complex regional politics. While the current relationship with the Egyptian government is strong, the region's inherent instability remains a constant factor.
    • Regulatory Risk (UK): The 78% Energy Profits Levy in the UK has effectively ended APA's growth in the North Sea and accelerated multi-million dollar decommissioning liabilities.
    • Commodity Price Volatility: Like all upstream companies, APA is a price-taker. A significant drop in Brent or WTI prices would squeeze the margins required to fund its international projects.

    Opportunities and Catalysts

    • Suriname Block 53: Beyond the current GranMorgu project, APA has significant exploration potential in adjacent blocks. Any discovery here could lead to a "Phase 2" expansion much sooner than expected.
    • Egypt Gas Pivot: If Egypt continues to increase its domestic gas pricing, APA’s returns from the Western Desert could surprise to the upside.
    • M&A Target: As the Permian continues to consolidate, APA’s high-quality acreage and Suriname exposure could make it an attractive acquisition target for a supermajor looking to replenish its pipeline.

    Investor Sentiment and Analyst Coverage

    Wall Street sentiment on APA is currently "cautiously bullish." Most analysts maintain "Buy" or "Overweight" ratings, citing the company's low valuation and the massive potential of Suriname. Hedge fund interest has stabilized as the company proved it could integrate Callon without ballooning its debt. Retail sentiment remains more skeptical, often focused on the company's historical volatility, but institutional support has strengthened as the company’s capital return framework became more predictable.

    Regulatory, Policy, and Geopolitical Factors

    The regulatory environment remains a headwind in some regions and a tailwind in others. In the U.S., APA faces constant scrutiny regarding methane emissions and flaring, though it has made significant strides in its ESG reporting. In the UK, the fiscal regime is actively hostile to oil and gas investment, which has dictated APA’s exit strategy. Conversely, the government of Suriname has been highly supportive, viewing the Block 58 development as a cornerstone of its national economic future.

    Conclusion

    APA Corporation in 2026 is a company in the midst of a high-stakes transition. It has successfully shed the "wildcatter" label of its past to become a disciplined producer with a world-class growth asset in Suriname. For investors, APA offers a unique proposition: the steady cash flow of a Permian producer combined with the "lottery ticket" upside of a massive offshore oil frontier.

    While the risks in Egypt and the North Sea remain, the company’s strengthened balance sheet and focused leadership suggest that APA is better positioned than ever to deliver long-term value. Investors should watch the progress of the GranMorgu FPSO construction and the 2028 production timeline as the ultimate barometers of the company's success.


    This content is intended for informational purposes only and is not financial advice.

  • Shale Giant to Mega-Independent: The 2026 Outlook for Devon Energy (DVN)

    Shale Giant to Mega-Independent: The 2026 Outlook for Devon Energy (DVN)

    As of April 13, 2026, the global energy landscape is caught in a precarious balance between the acceleration of the "green" transition and a resurging demand for traditional hydrocarbons driven by geopolitical instability. At the heart of this tension stands Devon Energy Corporation (NYSE: DVN), a heavyweight independent explorer and producer (E&P) that has fundamentally redefined the "shale playbook." Once a pure-play growth engine, Devon has transformed into a sophisticated, diversified cash-flow machine. With its recent $58 billion merger with Coterra Energy currently in the process of closing, Devon is pivoting toward a "mega-independent" status that positions it as a titan across not just oil-rich shale, but the high-demand natural gas markets of the Eastern United States.

    Historical Background

    Founded in 1971 by John Nichols and his son, J. Larry Nichols, Devon Energy’s journey from a small, family-run operation to a Fortune 500 staple is a masterclass in opportunistic expansion. Headquartered in Oklahoma City, the company initially gained prominence through its early adoption of horizontal drilling and hydraulic fracturing—technologies that unlocked the "shale revolution."

    Key milestones include the 2002 acquisition of Mitchell Energy, which solidified Devon’s position in the Barnett Shale, and the transformational 2021 merger with WPX Energy. The WPX deal was the catalyst for Devon’s "value-over-volume" strategy, shifting the company’s focus from aggressive production growth to capital discipline and shareholder returns. In late 2024, Devon further expanded its footprint by acquiring Grayson Mill Energy for $5 billion, effectively tripling its presence in the Williston Basin and proving that even in a maturing market, Devon remains a voracious and strategic acquirer.

    Business Model

    Devon Energy operates a multi-basin exploration and production model focused exclusively on the United States. Its revenue is primarily derived from the sale of oil, natural gas, and natural gas liquids (NGLs).

    Historically, the Delaware Basin (part of the larger Permian Basin) has served as the company’s "crown jewel," providing the highest margins and most prolific inventory. However, the 2026 business model is increasingly defined by diversification. Following the integration of the Grayson Mill assets in the Bakken and the pending Coterra merger, Devon’s asset base now spans the Delaware, Eagle Ford, Anadarko, Williston, and the gas-heavy Marcellus Shale. This "all-weather" portfolio allows the company to shift capital allocation toward whichever commodity—oil or gas—is offering the highest returns in a given macro environment.

    Stock Performance Overview

    Over the last decade, DVN’s stock has been a bellwether for the broader E&P sector.

    • 10-Year Horizon: Investors recall the "lost decade" of shale (2014-2020) where DVN, like many peers, struggled with over-leverage and low prices.
    • 5-Year Horizon: The stock saw a meteoric rise from 2021 to 2023, fueled by the post-pandemic energy crunch and the industry-leading introduction of the fixed-plus-variable dividend policy.
    • 1-Year Horizon: As of April 2026, the stock is trading near $47.80. While it has faced volatility due to fluctuating crude prices, the early 2026 Brent surge past $100/barrel—sparked by renewed Middle Eastern supply shocks—has triggered a significant "re-rating" of the stock as investors seek safe-haven American production.

    Financial Performance

    Devon’s 2025 fiscal year results, reported earlier this year, underscored its operational resilience.

    • Revenue: The company generated approximately $17.19 billion in total revenue.
    • Production: Production hit a record 848,000 barrels of oil equivalent (BOE) per day, largely thanks to the seamless integration of Grayson Mill assets.
    • Cash Flow: Devon produced $3.1 billion in Free Cash Flow (FCF) in 2025, a critical metric for a company committed to its variable dividend framework.
    • Balance Sheet: With a net debt-to-EBITDAX ratio of 0.9x, Devon maintains one of the cleanest balance sheets in the industry, providing the "dry powder" necessary for the Coterra acquisition without over-leveraging the enterprise.

    Leadership and Management

    A major transition occurred on March 1, 2025, when the architect of the modern Devon, Rick Muncrief, retired. The reins were handed to Clay Gaspar, who previously served as the company’s Chief Operating Officer.

    Gaspar is widely regarded as an operational specialist. While Muncrief focused on the "macro" of mergers and dividend policy, Gaspar’s tenure thus far has been defined by "inventory optimization"—using advanced data analytics and secondary recovery techniques to squeeze more value out of existing wells. His leadership was put to the test with the February 2026 announcement of the Coterra merger, a deal that signals Gaspar’s intent to make Devon a dominant player in the global LNG (Liquefied Natural Gas) supply chain.

    Products, Services, and Innovations

    Devon’s "product" is energy, but its competitive edge lies in technological innovation. The company has pioneered the use of "super-laterals"—wells that stretch over three miles horizontally—to maximize reservoir contact.

    Furthermore, Devon has invested heavily in ESG-centric innovations, such as automated methane leak detection and "re-fraccing" technologies that allow the company to revitalize older wells at a fraction of the cost of drilling new ones. These innovations have pushed Devon's breakeven costs down to approximately $40 per barrel (WTI), making it profitable even in significant market downturns.

    Competitive Landscape

    The E&P sector has undergone massive consolidation. Devon now competes in an era of "Super-Independents."

    • Rivals: Primary competitors include Diamondback Energy (NASDAQ: FANG), EOG Resources (NYSE: EOG), and the oil majors ExxonMobil (NYSE: XOM) and Chevron (NYSE: CVX).
    • Competitive Standing: While Diamondback has a larger pure-play Permian footprint, Devon’s geographic diversity (specifically its Bakken and Marcellus exposure) provides a hedge that many Permian-centric rivals lack. However, it faces stiff competition for Tier 1 drilling inventory, which is becoming increasingly scarce across the U.S.

    Industry and Market Trends

    The "Shale 4.0" era of 2026 is defined by three major trends:

    1. Consolidation: The $58 billion Coterra merger is part of a "final wave" of U.S. shale consolidation where only a few massive players will remain.
    2. Energy Security: Amid global conflicts, U.S. E&Ps are increasingly viewed as strategic national assets, leading to more favorable political treatment than seen in the early 2020s.
    3. The Gas Renaissance: As Europe and Asia scramble for non-Russian gas, the Marcellus assets Devon is acquiring will likely become the company’s highest-growth segment through 2030.

    Risks and Challenges

    • Inventory Depletion: There are mounting concerns that "Tier 1" (highest quality) inventory in the Permian is being exhausted faster than anticipated.
    • Regulatory Compliance: Stricter EPA and BLM regulations regarding methane emissions and water usage in New Mexico (where a large portion of Devon’s Delaware acreage sits) remain a constant compliance burden.
    • Commodity Volatility: Despite hedging and diversification, Devon remains highly sensitive to global price swings. A sudden de-escalation in geopolitical tensions could lead to a sharp pullback in prices.

    Opportunities and Catalysts

    • Coterra Synergies: Devon has guided for $1 billion in annual cost synergies from the Coterra merger. Achieving this ahead of schedule would be a massive catalyst for the stock.
    • LNG Exports: With its new gas-heavy portfolio, Devon is perfectly positioned to sign long-term supply agreements with Gulf Coast LNG export terminals, providing stable, long-term pricing.
    • M&A Target: In a world of "Mega-Majors," some analysts believe Devon itself could eventually become an acquisition target for a company like Chevron or Shell seeking to bolster its U.S. shale and gas presence.

    Investor Sentiment and Analyst Coverage

    Wall Street currently maintains a "Moderate Buy" consensus on DVN.

    • Price Targets: Median analyst price targets hover around $59.50, suggesting a ~24% upside from current levels.
    • Institutional Sentiment: Large institutions like BlackRock and Vanguard have maintained their positions, encouraged by the company's commitment to returning 50% of free cash flow to shareholders via dividends and buybacks.
    • Retail View: Retail investors remain fixated on the dividend yield, which remains one of the most attractive in the S&P 500 Energy sector.

    Regulatory, Policy, and Geopolitical Factors

    The 2026 regulatory environment is noticeably more pragmatic than that of the early 2020s. A shift in U.S. administrative policy toward "energy dominance" has resulted in faster federal permitting for LNG projects and drilling on federal lands. This is a direct tailwind for Devon, which has significant exposure to New Mexico’s federal acreage. Geopolitically, the continued disruption of the Strait of Hormuz has placed a premium on "onshore, stable" U.S. production, benefiting DVN’s valuation.

    Conclusion

    Devon Energy (NYSE: DVN) enters the mid-2020s not as a speculative driller, but as a disciplined energy powerhouse. Its move to merge with Coterra Energy marks a bold gamble on the long-term necessity of natural gas in the global energy mix. For investors, the "new" Devon offers a compelling blend of high-margin oil production and a massive strategic hedge in natural gas. While risks regarding inventory quality and commodity volatility remain, Devon’s fortress balance sheet and industry-leading shareholder return model make it a cornerstone holding for those seeking exposure to the evolving American energy landscape.


    This content is intended for informational purposes only and is not financial advice.

  • The Permian Juggernaut: A Comprehensive Research Feature on Diamondback Energy (FANG)

    The Permian Juggernaut: A Comprehensive Research Feature on Diamondback Energy (FANG)

    As of April 13, 2026, the American energy landscape is defined by a shift from the frantic growth of the "Shale 2.0" era toward a period of industrial-scale consolidation and manufacturing-style efficiency. At the center of this evolution stands Diamondback Energy, Inc. (NASDAQ: FANG). Once a mid-sized independent explorer, Diamondback has transformed into a dominant "Permian Juggernaut" following its massive 2024 merger with Endeavor Energy Resources. Today, it serves as the benchmark for operational excellence in the Midland Basin, providing a high-yield, low-cost alternative to the global integrated majors. With a focus on capital discipline and aggressive shareholder returns, Diamondback has become a staple for institutional and retail investors seeking exposure to the most prolific oil field in North America.

    Historical Background

    Diamondback Energy’s rise is a quintessential Permian success story. Founded in 2007 and headquartered in Midland, Texas, the company was built on the premise that a focused, pure-play operator could outperform diversified giants by mastering a single geography. Diamondback went public in 2012, raising $216 million at a time when horizontal drilling and hydraulic fracturing were revolutionizing the U.S. energy sector.

    Over the next decade, Diamondback pursued an aggressive "roll-up" strategy, acquiring smaller operators to assemble a massive, contiguous acreage position. Key milestones included the $9.2 billion acquisition of Energen in 2018 and the acquisitions of QEP Resources and Guidon Energy in 2021. However, the most defining moment in the company’s history occurred in September 2024, when it closed its $26 billion merger with Endeavor Energy Resources. This deal combined the two largest private and public pure-play Permian companies, creating a fortress-like position that critics and fans alike call the "King of the Midland Basin."

    Business Model

    Diamondback’s business model is characterized by geographic singularity and operational vertical integration. Unlike its peers that diversify into international offshore or renewable projects, Diamondback remains almost entirely focused on the Permian Basin, specifically the Midland and Delaware Basins of West Texas and New Mexico.

    Revenue Sources:
    The company generates revenue primarily through the sale of crude oil, natural gas, and natural gas liquids (NGLs). As of 2026, the company produces nearly 1 million barrels of oil equivalent per day (MBOE/d).

    Segments and Subsidiaries:

    • Exploration & Production (E&P): The core engine of the company, focused on drilling and completing horizontal wells.
    • Midstream & Minerals: Through its ownership in Viper Energy, Inc. (NASDAQ: VNOM), Diamondback controls the mineral rights under its acreage, providing a high-margin royalty stream that lowers its overall breakeven costs.
    • Water Management: The company owns extensive infrastructure for sourcing, transporting, and recycling water, which is a critical operational and environmental component of modern fracking.

    Stock Performance Overview

    Over the past decade, FANG has been one of the top performers in the energy sector, often decoupling from broader commodity price volatility through superior cost management.

    • 1-Year Performance: In the past 12 months leading up to April 2026, the stock has risen approximately 28%, significantly outperforming the Energy Select Sector SPDR Fund (XLE).
    • 5-Year Performance: Investors who held FANG through the post-pandemic recovery have seen returns exceeding 150%, fueled by the transition to a "returns-first" capital allocation model.
    • 10-Year Performance: Since 2016, Diamondback has evolved from a $10 billion mid-cap to a $50 billion+ large-cap powerhouse. Notable moves occurred in late 2024 following the Endeavor merger, which re-rated the stock as a "must-own" for large-cap value funds.

    As of today, April 13, 2026, FANG shares are trading near $192, reflecting a strong start to the year.

    Financial Performance

    Diamondback’s financial profile in 2026 is a study in cash flow generation. Following the integration of Endeavor’s high-margin assets, the company’s 2025 fiscal year was record-breaking.

    • Revenue and Cash Flow: In 2025, Diamondback generated approximately $8.8 billion in net cash from operations and $5.9 billion in Adjusted Free Cash Flow (FCF).
    • Shareholder Returns: The company maintains a policy of returning 50% of its FCF to stockholders. In February 2026, it raised its base dividend to $4.20 per share annually, supplemented by variable dividends and aggressive share buybacks.
    • Debt and Valuation: Following the $26 billion Endeavor deal, net debt peaked near $18 billion. Through disciplined divestitures and FCF allocation, Diamondback has reduced this to $14.6 billion as of early 2026, with a clear path to $10 billion by year-end. Trading at a Forward P/E of roughly 9.5x, FANG remains attractively valued compared to the broader S&P 500.

    Leadership and Management

    The leadership of Diamondback has undergone a planned and successful transition. Long-time CEO Travis Stice, who led the company from its IPO through its most transformative mergers, stepped down in May 2025. He now serves as Non-Executive Chairman.

    The current CEO, Kaes Van’t Hof, took the helm in May 2025 after serving as President and CFO. Van’t Hof is widely regarded as one of the sharpest financial minds in the oil patch. He is credited with designing the "Variable Dividend" framework that many other shale companies eventually adopted. Under his leadership, the strategy has shifted from "growth at any cost" to "sustainable industrial scale," emphasizing capital efficiency and data-driven drilling decisions.

    Products, Services, and Innovations

    Diamondback’s "product" is a barrel of oil produced at the lowest possible cost. Their competitive edge lies in their technical innovation:

    • Simul-Frac & Trim-Frac: Diamondback is a leader in simultaneous fracturing, where two wells are completed at once using a single fleet. This has reduced completion times by 20-30%.
    • AI and Digital Twins: In 2026, Diamondback is increasingly using AI to optimize well spacing. This prevents "well interference," where a new well (the child) negatively impacts the production of an older well (the parent).
    • Deep Horizon Exploration: To extend its runway, the company has recently begun exploring deeper formations such as the Barnett and Woodford zones within the Permian, diversifying its inventory beyond the traditional Wolfcamp and Bone Spring plays.

    Competitive Landscape

    The Permian Basin has become a land of giants. Diamondback’s primary competitors are:

    1. ExxonMobil (NYSE: XOM): Which acquired Pioneer Natural Resources in 2024 to become the Permian's top producer.
    2. Chevron (NYSE: CVX): A massive incumbent with legacy acreage and significant midstream assets.
    3. Occidental Petroleum (NYSE: OXY): A fierce competitor in the Delaware Basin with a focus on carbon capture.
    4. ConocoPhillips (NYSE: COP): Known for its high-quality acreage and low decline rates.

    Diamondback’s advantage is its agility and its "Permian-only" focus. While Exxon must worry about global refining and chemicals, Diamondback’s management team spends 100% of its time optimizing a single basin.

    Industry and Market Trends

    The shale sector in 2026 is facing a "Permian Plateau." Most of the easy-to-reach Tier 1 acreage has been drilled, leading to a scramble for secondary inventory and secondary recovery techniques.

    • Consolidation: The industry has shifted from hundreds of small operators to a handful of massive firms. This has brought "manufacturing-style" consistency to oil production.
    • Energy for AI: A burgeoning trend in 2026 is the role of natural gas in powering the AI revolution. Diamondback is uniquely positioned to supply natural gas to the growing number of data centers being built in Texas, providing a stable domestic market for its gas production.

    Risks and Challenges

    • Commodity Price Volatility: Despite low breakevens, a sustained drop in WTI oil prices below $50/bbl would pressure the variable dividend and slow debt reduction.
    • Inventory Depletion: While Diamondback has a 10-12 year runway of high-quality wells, the long-term question of "what comes next?" persists.
    • Environmental & Social Governance (ESG): Increasingly stringent methane leak regulations and water disposal rules in Texas pose operational challenges and potential cost increases.
    • Technological Plateau: If AI-driven productivity gains do not materialize as expected, the company may face rising service costs without offsetting efficiency.

    Opportunities and Catalysts

    • M&A Synergies: The company is currently on track to realize over $550 million in annual synergies from the Endeavor merger. Any over-performance here would be a direct boost to FCF.
    • Debt Milestone: Reaching the $10 billion net debt target in late 2026 is expected to trigger a significant increase in the share buyback program.
    • Natural Gas Pivot: If Texas successfully expands its gas-to-power infrastructure for the tech sector, Diamondback’s historically "disadvantaged" gas assets could see a massive valuation re-rating.

    Investor Sentiment and Analyst Coverage

    Wall Street remains overwhelmingly bullish on Diamondback. Out of 26 major analysts tracking the stock in April 2026, 22 maintain "Buy" or "Strong Buy" ratings.

    • Institutional Holdings: BlackRock and Vanguard remain top shareholders, viewing FANG as a "proxy" for the Permian Basin.
    • Retail Sentiment: Retail investors have been drawn to the transparency of the variable dividend, which provides a direct link between high oil prices and cash-in-pocket.
    • Bear Case: The few skeptics point to the company's premium valuation relative to smaller peers, suggesting that much of the "Endeavor magic" is already priced in.

    Regulatory, Policy, and Geopolitical Factors

    The regulatory environment in 2026 is a balancing act. While the federal government has eased some land-use restrictions to ensure domestic energy security, the EPA has tightened "Ozone" and "Methane" standards. Diamondback has mitigated this through its "Circle of Excellence" sustainability program, focusing on electrified drilling rigs and 100% water recycling.

    Geopolitically, the continued instability in the Middle East and Eastern Europe has kept a floor under oil prices, benefiting domestic producers like Diamondback that offer a "safe haven" for energy capital.

    Conclusion

    Diamondback Energy (NASDAQ: FANG) represents the "new era" of American oil. By 2026, it has successfully transitioned from a high-growth explorer to a disciplined, cash-generating machine. Its merger with Endeavor has given it the scale to compete with the global majors, while its nimble management team continues to extract more value from every acre than almost any other operator in the Permian.

    For investors, the FANG thesis is simple: it is a high-yield play on the world's best oil field. While risks regarding inventory depletion and commodity prices remain, Diamondback’s fortress balance sheet and industry-leading cost structure provide a significant margin of safety. As the company marches toward its debt targets in late 2026, the potential for even higher shareholder returns makes it a central pillar of any energy-focused portfolio.


    This content is intended for informational purposes only and is not financial advice.

  • The Fortress of the Permian: A Deep Dive into Occidental Petroleum (OXY) in 2026

    The Fortress of the Permian: A Deep Dive into Occidental Petroleum (OXY) in 2026

    Date: April 13, 2026

    Introduction

    As of early 2026, Occidental Petroleum Corporation (NYSE: OXY) stands as a unique paradox in the global energy landscape. Once a heavily indebted driller struggling under the weight of a massive acquisition, the company has reinvented itself into what analysts now call the "Fortress of the Permian." Today, Occidental is as much a carbon management pioneer as it is an oil and gas powerhouse. With its landmark Direct Air Capture (DAC) facility, Stratos, nearing full operations and a balance sheet finally purged of its post-2019 "acquisition hangover," OXY has become the primary laboratory for the energy transition. Underpinned by the unwavering support of Warren Buffett’s Berkshire Hathaway (NYSE: BRK.A), Occidental is no longer just a commodity play; it is a high-stakes bet on the future of "net-zero oil."

    Historical Background

    Founded in 1920, Occidental Petroleum’s history is defined by periods of aggressive expansion and larger-than-life leadership. For decades, the company was synonymous with Armand Hammer, the eccentric industrialist who transformed a minor California driller into a global conglomerate with interests ranging from chemicals to art. However, the modern era of OXY began in 2019 with its controversial $38 billion acquisition of Anadarko Petroleum.

    The deal, which involved a bidding war against Chevron (NYSE: CVX), was widely criticized for its timing—occurring just months before the COVID-19 pandemic crashed oil prices in 2020. This plunged the company into a multi-year crisis of debt and survival. The subsequent years were a grueling exercise in asset sales and cost-cutting, leading to the pivotal 2024 acquisition of CrownRock L.P., which solidified OXY’s dominance in the Midland Basin and marked the final phase of its strategic transformation.

    Business Model

    Occidental’s business model is built on three pillars, though one has recently undergone a major structural shift:

    1. Oil and Gas: The core engine, focused primarily on the Permian Basin in the U.S., the Rockies, and the Gulf of Mexico. It is a "Permian-first" model, emphasizing high-margin, low-decline assets.
    2. Low Carbon Ventures (LCV): Operating under the "1PointFive" brand, this segment focuses on commercializing Direct Air Capture (DAC) technology and carbon sequestration services. It generates revenue through the sale of carbon removal credits and the production of "net-zero oil" via Enhanced Oil Recovery (EOR).
    3. Midstream and Marketing: Provides gathering, processing, and transportation for its oil and gas production.
      Note: In January 2026, OXY completed the sale of its chemicals division, OxyChem, to Berkshire Hathaway for $9.7 billion, a move designed to achieve a target debt level of $15 billion.

    Stock Performance Overview

    Occidental’s stock has been a rollercoaster for long-term holders.

    • 1-Year Performance: In the past twelve months, OXY has outperformed the S&P 500 Energy Index, surging nearly 50% year-to-date by April 2026. This move was largely catalyzed by the OxyChem divestiture and the successful integration of CrownRock.
    • 5-Year Performance: From the depths of the 2020-2021 recovery, OXY has seen a meteoric rise. After trading in the $10-$20 range during the pandemic, it stabilized in the $50s and $60s through 2023-2025, before the current 2026 breakout.
    • 10-Year Performance: Despite the recent surge, the 10-year chart reflects the volatility of the 2019 Anadarko deal. Long-term investors who held through the 2020 crash have finally seen significant positive returns, though the stock spent much of the decade recovering lost ground.

    Financial Performance

    Financial discipline has been the company's mantra for the past 24 months.

    • Revenue and Income: For the full year 2025, OXY reported revenue of approximately $22.1 billion. Net income reached $1.6 billion, reflecting the high costs of integrating CrownRock but strong operational margins.
    • Debt Reduction: The primary financial story of 2026 is the reduction of principal debt to $15.0 billion—a staggering decline from the $40 billion high in 2019.
    • Shareholder Returns: In early 2026, the company raised its quarterly dividend by 8% to $0.26 per share ($1.04 annualized). With debt targets met, OXY is expected to pivot toward aggressive share buybacks in the second half of 2026.

    Leadership and Management

    In a move that surprised few but marked the end of an era, CEO Vicki Hollub announced her retirement in early 2026. Hollub, the first woman to lead a major U.S. oil company, will be remembered for her daring Anadarko bet and her vision for a carbon-neutral future.

    She is succeeded by Richard Jackson, formerly the Chief Operating Officer and the architect of the Low Carbon Ventures segment. Jackson’s appointment signals a permanent shift in OXY’s strategy: the "engineer-to-carbon-manager" transition is now complete. His leadership is expected to focus on scaling DAC technology while maintaining the operational excellence in the Permian that Hollub established.

    Products, Services, and Innovations

    The crown jewel of OXY’s innovation pipeline is the Stratos DAC plant in Ector County, Texas. As of April 2026, Stratos is in its final startup phase. This facility is the largest of its kind, designed to pull 500,000 metric tons of CO2 directly from the atmosphere annually.

    • Carbon Credits: OXY has already pre-sold millions in carbon credits to blue-chip customers like Microsoft (NASDAQ: MSFT) and Amazon (NASDAQ: AMZN).
    • Enhanced Oil Recovery (EOR): By injecting captured CO2 into aging wells, OXY can extract more oil while permanently sequestering the carbon. This allows the company to market "Net Zero Oil," a product with a lower carbon footprint than traditional crude, which commands a premium in certain markets.

    Competitive Landscape

    The energy landscape has consolidated significantly by 2026.

    • ExxonMobil (NYSE: XOM): Following its Pioneer acquisition, Exxon is the volume king of the Permian. Exxon’s scale gives it an advantage in logistics and cost per barrel, but it is moving slower on DAC technology than OXY.
    • Chevron (NYSE: CVX): Chevron remains a formidable rival with a diversified global portfolio. While Chevron has invested in carbon capture, OXY’s pure-play commitment to Direct Air Capture gives it a "first-mover" status in the carbon economy.
    • Scale vs. Specialization: OXY currently produces roughly 1.48 million boe/d. While smaller than the supermajors, its specialization in the Permian and LCV gives it higher leverage to domestic policy and carbon credit pricing.

    Industry and Market Trends

    The "Great Consolidation" of 2024-2025 has left the U.S. shale industry in the hands of a few disciplined giants.

    • Capital Discipline: The industry has shifted from "growth at all costs" to "cash flow and dividends."
    • Carbon Valuation: As global carbon taxes and reporting requirements tighten, the ability to sequester CO2 has become a financial asset.
    • Energy Security: Geopolitical tensions continue to keep oil prices in a range ($75-$85) that is highly profitable for Permian operators like OXY.

    Risks and Challenges

    • Technology Scaling: While Stratos is a marvel, the technical risk of scaling DAC to millions of tons remains unproven at a profitable margin without government subsidies.
    • Commodity Volatility: Despite the carbon pivot, OXY remains highly sensitive to WTI oil prices. A global recession could still significantly impact its cash flow.
    • Management Transition: The departure of Vicki Hollub introduces execution risk as Richard Jackson takes the helm during a critical integration period for CrownRock and LCV.

    Opportunities and Catalysts

    • Berkshire "Endgame": With Berkshire Hathaway now owning 31% of the common stock and having acquired OxyChem, rumors of a full acquisition by Warren Buffett persist. Such a move would likely come at a significant premium.
    • DAC Expansion: Success at Stratos could lead to the deployment of up to 100 DAC plants globally by 2035, turning OXY into a service provider for other industries' emissions.
    • Inflation Reduction Act (IRA): Continued 45Q tax credits provide a massive tailwind for OXY’s carbon sequestration efforts, effectively subsidizing the transition.

    Investor Sentiment and Analyst Coverage

    Wall Street remains divided but generally bullish on OXY.

    • Bull Case: Analysts point to the "Buffett Floor," suggesting that Berkshire’s continuous buying limits downside risk. The deleveraging story is viewed as a major success.
    • Bear Case: Skeptics argue that OXY is spending too much capital on unproven carbon technology when it could be returning more cash to shareholders.
    • Current Ratings: As of April 2026, consensus among major banks is a "Buy" or "Overweight," with price targets averaging in the mid-$70s.

    Regulatory, Policy, and Geopolitical Factors

    OXY is perhaps more exposed to U.S. policy than any other oil major.

    • The IRA Tailwinds: The 45Q tax credit, which provides up to $180 per ton of carbon sequestered via DAC, is the bedrock of OXY’s LCV segment. Any political shift that threatens these credits is a primary risk.
    • Environmental Oversight: Stricter EPA methane rules and Permian basin drilling permits are constant regulatory hurdles.
    • Global Carbon Markets: The development of a global compliance market for carbon credits would exponentially increase the value of OXY's DAC portfolio.

    Conclusion

    Occidental Petroleum in 2026 is a company that has successfully walked a tightrope. It survived the debt crisis of the early 2020s, doubled down on its Permian heartland, and emerged as the global leader in Direct Air Capture. While risks regarding technology scaling and commodity prices remain, the "Buffett-backed" fortress looks more resilient than ever. For investors, OXY represents a unique hybrid: a cash-generative oil producer for today, and a carbon management giant for tomorrow. The transition under Richard Jackson will be the defining chapter for whether OXY can truly decouple its valuation from the volatility of the oil barrel.


    This content is intended for informational purposes only and is not financial advice.

  • The Tech Giant of the Oilfield: A Comprehensive Deep Dive into Baker Hughes (BKR)

    The Tech Giant of the Oilfield: A Comprehensive Deep Dive into Baker Hughes (BKR)

    Date: April 13, 2026

    Introduction

    As of mid-2026, the energy sector has undergone a profound structural shift, and few companies embody this transformation more than Baker Hughes (NASDAQ: BKR). Once categorized simply as a "Big Three" oilfield services provider, Baker Hughes has successfully pivoted into a diversified energy technology leader. Today, the company stands at the intersection of traditional hydrocarbon efficiency and the burgeoning green energy infrastructure. With a record backlog, a dominant position in the global Liquefied Natural Gas (LNG) market, and a strategic expansion into data center power solutions, Baker Hughes is no longer just a proxy for oil prices; it is a critical player in the global energy transition and industrial electrification.

    Historical Background

    The lineage of Baker Hughes traces back to two of the most significant inventions in the oil age. In 1907, Reuben Baker developed a casing shoe that revolutionized cable-tool drilling, leading to the founding of Baker Memorial Corporation. Simultaneously, in 1908, Howard Hughes Sr. developed the sharp-cone roller bit, which allowed for drilling through hard rock, giving birth to the Hughes Tool Company. The two entities merged in 1987 to form Baker Hughes Incorporated, creating a powerhouse in drilling and completions.

    The modern era of the company, however, was defined by its tumultuous relationship with General Electric (NYSE: GE). In 2017, GE merged its Oil & Gas division with Baker Hughes, creating "BHGE." This partnership was short-lived as GE began divesting its stake in 2019 to shore up its own balance sheet. Under the leadership of Lorenzo Simonelli, Baker Hughes reclaimed its independence, completing its final separation from GE in 2022. This separation allowed the company to shed its conglomerate baggage and focus on a dual-track strategy: optimizing oilfield services while aggressively scaling its industrial and energy technology divisions.

    Business Model

    Baker Hughes operates through a streamlined two-segment structure designed to balance steady cash flow with high-growth technology ventures.

    1. Oilfield Services & Equipment (OFSE): This segment provides the "traditional" services required for the lifecycle of an oil or gas well. It includes well construction, completions, and production solutions. While it remains a significant revenue driver, the company has pivoted away from the low-margin, high-volatility North American fracking market to focus on international and offshore projects which offer more stable, long-term contracts.
    2. Industrial & Energy Technology (IET): The crown jewel of the current business model, IET focuses on gas technology, turbomachinery, and digital solutions. This segment is the world leader in LNG liquefaction equipment and is the primary vehicle for the company’s expansion into hydrogen, carbon capture, and industrial power.

    Stock Performance Overview

    Over the past decade, BKR's stock has reflected the company’s structural metamorphosis.

    • 10-Year View: The stock spent much of 2016–2019 in a volatile range, weighed down by the complex GE merger and a lackluster oil price environment.
    • 5-Year View: Since 2021, BKR has significantly outperformed the broader S&P 500 Energy Index. Rising from pandemic lows of under $15 in 2020, the stock hit a milestone all-time high of $65.26 in February 2026.
    • 1-Year View: Over the last twelve months, the stock has gained approximately 22%, driven by record-breaking orders in the IET segment and the successful navigation of the Chart Industries (NYSE: GTLS) acquisition integration.

    Financial Performance

    The fiscal year 2025 was a landmark for Baker Hughes, and early 2026 data suggests continued momentum.

    • Revenue and EBITDA: In 2025, the company reported revenue of $27.70 billion. More importantly, Adjusted EBITDA reached a record $4.83 billion. Management is currently targeting a 20% total company EBITDA margin by 2028.
    • Cash Flow: Free Cash Flow (FCF) hit a record $2.73 billion in 2025, allowing the company to maintain a robust capital return program, including dividends and share buybacks.
    • Backlog: As of April 2026, the total backlog stands at an unprecedented $35.9 billion, providing multi-year revenue visibility. Notably, over 90% of this backlog resides in the high-margin IET segment.

    Leadership and Management

    CEO Lorenzo Simonelli has been the architect of the "New Baker Hughes." Having led the company through the GE merger and subsequent divorce, Simonelli is widely respected for his "Horizon" strategy.

    • Horizon One (2022-2025): Focused on simplifying the organization and maximizing the core.
    • Horizon Two (2026-2028): Currently underway, this phase focuses on margin expansion and scaling the IET business.
    • Leadership Style: Simonelli is viewed as a "pragmatic decarbonizer," focusing on technology that makes fossil fuels cleaner while building the infrastructure for the next generation of energy.

    Products, Services, and Innovations

    Baker Hughes has successfully moved "beyond the bit."

    • LNG Turbomachinery: BKR owns roughly 90% of the market share for the turbines that power LNG liquefaction plants.
    • Data Center Power: In a surprise move in 2025, BKR secured over $1 billion in orders for gas-fired on-site power solutions for AI data centers, leveraging their turbomachinery expertise to solve the "power gap" in the tech industry.
    • Hydrogen and CCUS: The company is a key provider for the NEOM Green Hydrogen project and has secured major Carbon Capture, Utilization, and Storage (CCUS) contracts in the UK and Gulf Coast.

    Competitive Landscape

    The competitive environment for Baker Hughes has shifted. While it still competes with SLB (NYSE: SLB) and Halliburton (NYSE: HAL) in the oilfield, it now also competes with industrial giants like Siemens Energy (XETRA: ENR) and Mitsubishi Heavy Industries.

    • SLB: Remains the leader in subsurface digital and global integrated services.
    • Halliburton: Remains the king of North American shale.
    • Baker Hughes: Has carved out a niche as the "Industrial Tech" leader, making it less sensitive to day-to-day fluctuations in the rig count and more sensitive to global capital expenditure in gas and green energy.

    Industry and Market Trends

    The "Golden Age of Gas" remains a tailwind. As nations seek to balance energy security with decarbonization, LNG has become the "bridge fuel" of choice. Furthermore, the massive power requirements of AI and the global push for "Net Zero" have created a secondary market for BKR’s industrial turbines and carbon management solutions. The cyclicality of the oil industry is being replaced, for BKR, by the structural growth of global energy infrastructure.

    Risks and Challenges

    Despite the positive momentum, several risks remain:

    • Acquisition Integration: The $13.6 billion acquisition of Chart Industries in 2025 was a massive bet. Successfully integrating this business and managing the $9 billion in debt issued to fund it is a significant operational hurdle.
    • Geopolitical Sensitivity: With a massive international footprint, BKR is exposed to regional conflicts and trade tensions that could delay large-scale infrastructure projects.
    • The Pace of the Energy Transition: If the adoption of hydrogen or carbon capture slows due to policy shifts or economic headwinds, BKR’s "New Energy" investments may take longer to reach profitability.

    Opportunities and Catalysts

    • The "Chart" Synergy: Once the Chart Industries integration is complete (expected mid-2026), BKR will be an end-to-end provider of cryogenic and liquid gas equipment, a critical component for the global hydrogen economy.
    • Data Center Expansion: As the AI boom continues, the demand for off-grid, reliable gas power for data centers represents a multi-billion dollar "total addressable market" expansion.
    • Stock Re-Rating: If BKR continues to prove its industrial tech credentials, it may see a P/E ratio expansion, moving from an "Energy" multiple (typically 10-15x) to an "Industrial/Tech" multiple (20x+).

    Investor Sentiment and Analyst Coverage

    Wall Street is increasingly bullish on BKR. As of April 2026, the majority of analysts carry a "Buy" or "Strong Buy" rating. Institutional investors have praised the company's capital discipline and the clarity of the "Horizon Two" strategy. There is a growing sentiment that BKR is the "safest" way to play the energy transition because it provides the essential hardware (turbines, compressors, valves) regardless of which specific green technology wins the market.

    Regulatory, Policy, and Geopolitical Factors

    Baker Hughes is a major beneficiary of the U.S. Inflation Reduction Act (IRA) and similar green subsidies in Europe, which provide tax credits for carbon capture and hydrogen production. Conversely, the company must navigate tightening methane emission regulations globally. Geopolitically, the shift away from Russian gas has permanently elevated the importance of U.S. and Qatari LNG, both of which rely heavily on Baker Hughes technology.

    Conclusion

    Baker Hughes has successfully navigated a decade of identity crises to emerge as a premier energy technology company. By decoupling its fortunes from the North American drilling cycle and anchoring itself in the global LNG and industrial power markets, the company has created a resilient and high-margin business model. While the debt load from recent acquisitions requires careful management, the record backlog and dominant market position in transition technologies make BKR a compelling story for the second half of the decade. For investors, the key will be watching the execution of the 20% EBITDA margin target and the seamless integration of its new cryogenic and industrial power assets.


    This content is intended for informational purposes only and is not financial advice.

  • The Invisible Engine of Home Improvement: A Deep Dive into Hillman Solutions Corp (HLMN)

    The Invisible Engine of Home Improvement: A Deep Dive into Hillman Solutions Corp (HLMN)

    April 13, 2026

    Introduction

    In the world of high-growth tech and volatile crypto, it is often the "boring" businesses that provide the most reliable foundations for a portfolio. Hillman Solutions Corp (NASDAQ: HLMN) is the quintessential example of this phenomenon. Headquartered in Cincinnati, Hillman is the invisible engine behind the North American hardware industry. Whether it is a homeowner replacing a door hinge, a DIYer duplicating a car key, or a contractor purchasing work gloves, Hillman is almost certainly the provider.

    As of April 2026, Hillman finds itself at a critical juncture. Having successfully navigated the post-SPAC transition and a significant leadership handoff, the company is now executing its "2030 Blueprint," aiming for $2.5 billion in sales. In an environment where interest rates remain a point of contention and the housing market is slowly thawing, Hillman’s unique service-led model and high-margin robotics division have made it a focal point for value-oriented institutional investors.

    Historical Background

    Founded in 1964 by Max W. Hillman Sr., the company began as a modest fastener distributor in Ohio. Its early success was not just based on the products it sold—nuts, bolts, and screws—but on how it sold them. Hillman pioneered the concept of high-touch service in the hardware aisle, organizing thousands of small Stock Keeping Units (SKUs) that would otherwise be a nightmare for retail store managers to maintain.

    Over the decades, Hillman underwent several transformations, often backed by private equity firms like Code Hennessy & Simmons and later CCMP Capital. These eras saw the company expand from basic hardware into complex niches. A pivotal moment occurred in the 2010s with the acquisition of TagWorks and MinuteKey, which moved the company into the high-margin world of automated kiosks.

    In 2021, Hillman entered the public markets via a merger with Landcadia Holdings III, a Special Purpose Acquisition Company (SPAC). While many SPAC-era companies faltered, Hillman used the capital to deleverage and double down on its "Direct-to-Store Delivery" (DSD) competitive advantage.

    Business Model

    Hillman’s business model is structured around three primary pillars:

    1. Hardware & Protective Solutions (HPS): This is the core of the business, representing roughly 70% of revenue. It encompasses traditional fasteners, builder’s hardware, and personal protective equipment (PPE).
    2. Robotics & Digital Solutions (RDS): This is Hillman’s "growth engine." Through its MinuteKey and TagWorks brands, the company operates thousands of self-service kiosks that duplicate keys and engrave pet tags. This segment carries significantly higher margins than traditional hardware.
    3. Canada: A mirroring of the US segments, tailored to the Canadian retail landscape.

    The true "secret sauce" of Hillman is its Direct-to-Store Delivery (DSD) model. Hillman employs a field force of over 1,100 associates who physically visit approximately 40,000 retail locations. They don't just drop off boxes; they stock the shelves, optimize the "planograms," and ensure that the "complex" hardware aisle—often the most difficult part of a store to manage—is profitable and organized. This creates a massive barrier to entry for competitors who lack the scale to provide similar labor-saving services to big-box retailers.

    Stock Performance Overview

    Since its public debut in 2021 at the traditional $10 SPAC price, HLMN has experienced the typical volatility of a mid-cap industrial stock.

    • 1-Year Performance: Over the past twelve months (mid-2025 to April 2026), the stock has shown resilience, rising approximately 18% as the company successfully integrated the Campbell Chain acquisition and demonstrated margin expansion.
    • 5-Year Performance: Looking back to its 2021 listing, the stock has essentially completed a "round trip." After dipping into the $7 range during the 2022-2023 interest rate hiking cycle, it has climbed back toward the $11-$13 range as of today, rewarding patient "buy-and-hold" investors.
    • 10-Year Context: While the company has only been public for five years, its pre-IPO history showed consistent mid-single-digit organic growth, a trend that has accelerated in the public era through strategic M&A.

    Financial Performance

    Hillman’s fiscal year 2025 results, finalized earlier this year, marked a record for the company.

    • Revenue: Reached $1.55 billion in 2025, a 5.4% increase over 2024.
    • EBITDA: Adjusted EBITDA hit $275.3 million, with margins expanding to 17.7% due to operational efficiencies and the high-margin contribution of the Robotics segment.
    • Debt Profile: One of the most significant wins for management has been deleveraging. The net-debt-to-Adjusted-EBITDA ratio fell to 2.4x by early 2026, down from over 4.0x shortly after the SPAC merger.
    • Valuation: As of April 13, 2026, HLMN trades at a forward P/E of approximately 15x, which many analysts view as attractive given its defensive characteristics and high-margin robotics growth.

    Leadership and Management

    In January 2025, Hillman underwent a seamless leadership transition. Long-time CEO Douglas Cahill, credited with steering the company through its public listing and the COVID-19 pandemic, moved into the role of Executive Chairman. Jon Michael Adinolfi, formerly the Chief Operating Officer, stepped into the President and CEO role.

    Adinolfi’s strategy has been defined by the "Blueprint for Value Creation," which focuses on organic growth in the "Pro" channel (selling to professional contractors) and disciplined M&A. The management team is generally regarded by Wall Street as conservative in their guidance but aggressive in their operational execution.

    Products, Services, and Innovations

    The jewel in Hillman’s innovation crown is the MinuteKey 3.5 kiosk. Moving beyond simple brass house keys, the latest generation of kiosks can duplicate modern automotive keys with transponder chips and RFID fobs for apartment buildings. This has transformed a $5 transaction into a $50-$100 transaction, significantly increasing the "revenue per square foot" for retail partners like Home Depot (NYSE: HD) and Lowe’s (NYSE: LOW).

    Furthermore, the 2026 integration of Campbell Chain & Fittings has allowed Hillman to offer industrial-grade lifting and rigging products, expanding its footprint in the lucrative Maintenance, Repair, and Operations (MRO) market.

    Competitive Landscape

    Hillman operates in a fragmented market but holds a dominant position in the "Big Box" retail channel.

    • Fasteners: Primary rivals include ITW (Illinois Tool Works) and PrimeSource. However, Hillman’s DSD service model makes it difficult for these competitors to displace them at the retail level.
    • Keys: In the robotics space, Hillman competes with KeyMe. While KeyMe has an aggressive AI-driven marketing strategy, Hillman’s deep-rooted relationships with Walmart (NYSE: WMT) and its massive installed base of physical kiosks give it a structural advantage.

    Industry and Market Trends

    The "Repair and Remodel" (R&R) market is the primary driver for Hillman. Unlike companies that rely on new home starts, Hillman thrives when people stay in their homes and perform maintenance.

    • Housing Turnover: In 2025 and early 2026, low housing turnover (due to high mortgage rates) actually benefitted Hillman’s PPE and "break-fix" hardware sales as homeowners chose to repair rather than move.
    • The "Pro" Shift: There is a growing trend of retailers focusing on the "Pro" customer. Hillman has responded by expanding its product depth in heavy-duty fasteners and industrial chains.

    Risks and Challenges

    Despite its strengths, Hillman faces several hurdles:

    • Customer Concentration: A significant portion of revenue comes from the "Big Three" (Home Depot, Lowe's, Walmart). Any change in these retailers’ sourcing strategies would be material.
    • Commodity Volatility: The cost of steel, zinc, and resin directly impacts Hillman’s margins. While they have successfully passed through price increases in the past, there is a limit to consumer price elasticity.
    • Interest Rate Sensitivity: While "break-fix" is resilient, larger renovation projects (which drive bulk fastener sales) are sensitive to consumer credit conditions.

    Opportunities and Catalysts

    • M&A Pipeline: Hillman continues to look for "bolt-on" acquisitions in the HVAC, plumbing, and electrical fastener spaces.
    • Robotics Expansion: There is significant "white space" for MinuteKey and TagWorks kiosks in grocery stores and international markets.
    • E-commerce Integration: Hillman’s "Endless Aisle" program allows customers to order specialized items at a kiosk for home delivery, merging physical retail with digital convenience.

    Investor Sentiment and Analyst Coverage

    Sentiment among institutional investors is overwhelmingly positive, with institutional ownership sitting at a staggering 98%. Firms like Vanguard and BlackRock remain top holders. Wall Street analysts maintain a "Moderate Buy" consensus, with price targets generally ranging from $12 to $15. The prevailing narrative is that Hillman is a "deleveraging story" that is transitioning into a "compounding story."

    Regulatory, Policy, and Geopolitical Factors

    Hillman has been proactive in its "China Plus One" strategy. Over the last three years, the company has reduced its sourcing exposure to China from 50% to roughly 20%, shifting production to Taiwan, India, and Vietnam. This move has mitigated the impact of tariffs and reduced supply chain risks associated with geopolitical tensions in the Pacific.

    Conclusion

    Hillman Solutions Corp represents a rare blend of old-school industrial reliability and new-school technological innovation. Its DSD model is a formidable moat that competitors struggle to bridge, and its robotics division offers a high-margin tailwind that most hardware companies lack.

    For the investor looking toward the second half of 2026, Hillman is no longer just a "SPAC that survived." It is a disciplined, cash-generative leader in a fragmented industry. While macro headwinds in the housing market remain a factor to watch, Hillman’s shift toward the professional channel and its continued debt reduction suggest it is well-positioned for the long haul.


    This content is intended for informational purposes only and is not financial advice.,tags:[

  • RTX: The Industrial Backbone of a New Geopolitical Era (2026 Analysis)

    RTX: The Industrial Backbone of a New Geopolitical Era (2026 Analysis)

    As of April 13, 2026, RTX Corporation (NYSE: RTX) stands as a titan at the intersection of global security and commercial mobility. Once a sprawling conglomerate navigating the complexities of a massive 2020 merger, RTX has evolved into a streamlined powerhouse. The company is currently operating in a unique "super-cycle" where a resurgence in commercial air travel overlaps with the most significant global rearmament effort since the Cold War. With a record-breaking backlog of $268 billion and a dominant position in missile defense, RTX is no longer just a participant in the aerospace and defense (A&D) sector; it is a fundamental pillar of Western industrial strategy. This article explores how RTX overcame significant operational hurdles to become one of the most vital components of the modern global economy.

    Historical Background

    The story of RTX is one of strategic consolidation. The company was formed by the 2020 "merger of equals" between United Technologies Corporation (UTC) and Raytheon Company. This $135 billion transaction fundamentally reshaped the A&D landscape, combining UTC’s commercial aerospace expertise (Pratt & Whitney and Collins Aerospace) with Raytheon’s defense electronics and missile capabilities.

    The roots of the company stretch back to the early 20th century. United Technologies was the successor to United Aircraft and Transport Corporation, founded in 1934, which at various times owned Boeing and Pratt & Whitney. Raytheon, founded in 1922 in Cambridge, Massachusetts, rose to prominence during World War II as a pioneer in radar technology and later became the world’s leading manufacturer of guided missiles.

    Over the years, the combined entity has undergone several transformations. Following the 2020 merger, the company rebranded from Raytheon Technologies to RTX in 2023, signaling a shift toward a more integrated corporate identity. By 2024, the company simplified its structure into three distinct business units to improve operational agility and transparency.

    Business Model

    RTX’s business model is uniquely balanced between commercial aviation and defense, providing a natural hedge against sector-specific downturns. The company generates revenue through three primary segments:

    1. Collins Aerospace: A global leader in technologically advanced and intelligent solutions for the global aerospace and defense industry. It provides everything from flight control systems and avionics to interiors and power systems.
    2. Pratt & Whitney: A world-class designer and manufacturer of aircraft engines and auxiliary power units. This segment is the heart of RTX’s commercial engine business, notably the Geared Turbofan (GTF) engine, while also producing the F135 engine for the F-35 Lightning II.
    3. Raytheon: The defense-focused arm, specializing in integrated air and missile defense, radars, and precision weapons. It is the lead contractor for the Patriot missile system and the AMRAAM missile.

    As of early 2026, the revenue split is approximately 55% commercial and 45% defense, a diversification strategy that has proved resilient through the turbulence of the early 2020s.

    Stock Performance Overview

    Over the last decade, RTX (and its predecessor entities) has delivered a narrative of volatility followed by vigorous recovery.

    • 10-Year Horizon: Investors who held through the UTC/Raytheon merger have seen a transformation from a fragmented industrial conglomerate to a focused A&D leader. While the 2020–2022 period was marked by pandemic-related aviation lows, the stock has significantly outperformed the S&P 500 in the trailing five-year period.
    • 5-Year Horizon: The stock faced a significant crisis in late 2023 when a "powder metal" defect in Pratt & Whitney engines caused a mass grounding of aircraft, sending the stock into the mid-$70s. However, since the start of 2024, RTX has staged a remarkable recovery.
    • 1-Year Horizon: In the past 12 months, RTX shares have surged by over 25%, reaching new all-time highs in early 2026. This move has been fueled by robust defense demand in Europe and the Indo-Pacific and a successful remediation plan for the GTF engine issues.

    Financial Performance

    RTX’s financial health in 2026 reflects a company that has successfully navigated its most significant operational headwinds.

    • Revenue and Earnings: For the full year 2025, RTX reported $88.6 billion in revenue, a 10% increase year-over-year. Adjusted earnings per share (EPS) reached $6.29. For FY 2026, management has guided for revenue of $92–$93 billion and an adjusted EPS range of $6.60–$6.80.
    • Cash Flow: Free Cash Flow (FCF), the lifeblood of the company’s dividend and buyback programs, is surging. After being depressed by GTF compensation payments in 2024 ($4.5B), FCF rose to $7.9B in 2025 and is projected to reach $8.25–$8.75 billion in 2026.
    • Margins: Operating margins have expanded to the 11-12% range as the company benefits from high-margin aftermarket services in commercial aviation and the ramp-up of munitions production.
    • Valuation: Trading at approximately 29x forward earnings, RTX is valued as a premium growth play compared to its historical average of 18-22x, reflecting the long-term visibility provided by its massive backlog.

    Leadership and Management

    The current era of RTX is defined by the leadership of Christopher Calio, who took over as CEO in May 2024 and was appointed Chairman in 2025. Calio, a veteran of Pratt & Whitney, has been credited with a "no-nonsense" approach to operational execution.

    Under Calio, the strategy has shifted from the high-level M&A integration of the Greg Hayes era to a focus on operational simplification. Calio has aggressively moved to de-risk the GTF engine recovery and has restructured the Raytheon segment to better meet the soaring demand for munitions. The leadership team, including CFO Neil Mitchill Jr., is currently focused on returning capital to shareholders, having committed to $30 billion-plus in capital returns through 2025-2026.

    Products, Services, and Innovations

    RTX is an innovation engine, spending billions annually on Research & Development.

    • Defense Innovation: The Lower Tier Air and Missile Defense Sensor (LTAMDS) is a game-changer. This 360-degree radar replaces the aging Patriot radar, providing a massive leap in capability against hypersonic threats.
    • Commercial Innovation: Pratt & Whitney’s GTF Advantage engine is the next iteration of the geared turbofan, designed to be more fuel-efficient and compatible with 100% Sustainable Aviation Fuel (SAF).
    • Munitions Surge: RTX has moved into a "war footing" for production. The company is currently doubling the production rates for the Javelin anti-tank missile and significantly increasing the output of the AMRAAM (Advanced Medium-Range Air-to-Air Missile) to over 1,900 units annually.

    Competitive Landscape

    RTX competes in a landscape of giants, primarily Lockheed Martin (NYSE: LMT), Northrop Grumman (NYSE: NOC), and Boeing (NYSE: BA).

    • Vs. Lockheed Martin: While Lockheed dominates the F-35 program (RTX is a key supplier for the engine), RTX is the undisputed leader in missile defense and sensors. RTX is generally seen as more diversified due to its commercial exposure.
    • Vs. Boeing: RTX has outperformed Boeing significantly in recent years. Boeing’s struggles with quality control and its high debt-to-capital ratio (90%) contrast sharply with RTX’s relatively clean balance sheet and operational consistency.
    • Market Share: RTX holds a dominant position in the "aftermarket" sector of commercial aviation—a high-margin business that provides a recurring revenue stream that pure-play defense contractors lack.

    Industry and Market Trends

    The A&D industry is currently experiencing a structural shift from "just-in-time" to "just-in-case" inventory management.

    • Rearmament: NATO countries and Indo-Pacific allies are significantly increasing defense spending to 2-3% of GDP. This has created a "multi-year tail" for RTX’s defense products.
    • Commercial Travel Resilience: Despite global economic fluctuations, passenger demand has remained remarkably resilient, driving a need for new, more efficient aircraft and the maintenance of aging fleets.
    • Supply Chain Brittleness: A persistent trend in 2026 is the struggle to find skilled labor and raw materials for forgings and castings. This remains the primary constraint on RTX’s ability to turn its backlog into realized revenue faster.

    Risks and Challenges

    No investment is without peril, and RTX faces several specific risks:

    • GTF Lingering Impact: While the "powder metal" crisis is largely contained, any further technical issues with the Pratt & Whitney engine fleet could lead to additional multi-billion dollar compensation claims from airlines.
    • Supply Chain Constraints: The company’s ability to meet its 2026-2027 delivery targets depends on a fragile network of sub-tier suppliers.
    • Valuation Risk: At 29x forward P/E, the stock is "priced for perfection." Any miss in quarterly earnings or a slowdown in defense appropriations could lead to a sharp correction.
    • Geopolitical De-escalation: While unlikely in the current climate, any significant peace breakthrough in Ukraine or the Middle East could lead to a "cooling" of the defense spending cycle.

    Opportunities and Catalysts

    • European Rearmament: RTX is poised to capture the lion's share of the European integrated air defense market. The Patriot system has become the gold standard, with countries like Poland and Germany placing massive multi-year orders.
    • The Hypersonic Race: RTX is at the forefront of developing defensive systems to counter hypersonic missiles, a multi-billion dollar emerging market for the Pentagon.
    • Share Buybacks: With FCF expected to surge past $8 billion, RTX has the capacity to aggressively buy back shares, providing a floor for the stock price and boosting EPS.

    Investor Sentiment and Analyst Coverage

    Wall Street is cautiously optimistic on RTX. As of April 2026, the consensus rating is a "Moderate Buy."

    • Analyst Views: Many analysts highlight RTX as a "best-of-breed" industrial. Median price targets hover around $225.00, with some bulls looking toward $240.00 if the company beats its 2026 FCF guidance.
    • Institutional Sentiment: Large asset managers like Vanguard and BlackRock remain major holders. Hedge fund interest has increased in 2025 as the GTF engine risk transitioned from an "unknown" to a "calculable" liability.
    • Retail Chatter: Retail investor sentiment has improved as the company moved past its 2023 lows, with many viewing RTX as a reliable dividend-growth stock.

    Regulatory, Policy, and Geopolitical Factors

    RTX is heavily influenced by the "Buy American" provisions and U.S. export controls.

    • Defense Budgets: The U.S. defense budget for FY 2026 reflects a focus on "Pacific Deterrence," which heavily favors the high-tech sensors and missiles produced by the Raytheon segment.
    • Foreign Military Sales (FMS): RTX is a primary beneficiary of the U.S. government’s FMS program, which facilitates the sale of Patriot and Javelin systems to allies.
    • ESG and Regulation: RTX is under increasing pressure to meet sustainability goals, particularly in its Pratt & Whitney segment, as the aviation industry faces stricter carbon emission regulations in Europe.

    Conclusion

    RTX Corporation in 2026 is a company that has successfully weathered the storm. By successfully integrating the Raytheon/UTC merger and managing through the Pratt & Whitney engine crisis, it has emerged as a high-margin, diversified giant with unprecedented revenue visibility.

    For investors, the case for RTX rests on its $268 billion backlog and its role as the primary provider of the world’s defensive shield. While the stock’s current valuation leaves little room for operational error, the "rearmament super-cycle" and the recovery of commercial aviation provide a powerful tailwind. Investors should watch for the company's ability to navigate supply chain constraints and the continued stabilization of the GTF engine fleet as the key markers for performance through the remainder of the decade.


    This content is intended for informational purposes only and is not financial advice.

  • The Blue Team’s Digital Pivot: A Deep Dive into Fastenal’s Industrial Dominance

    The Blue Team’s Digital Pivot: A Deep Dive into Fastenal’s Industrial Dominance

    In the world of industrial distribution, few names command as much respect for operational consistency as Fastenal Company (NASDAQ: FAST). Known colloquially as the "Blue Team," Fastenal has transitioned from a small-town fastener shop in Winona, Minnesota, to a high-tech supply chain powerhouse. As of April 13, 2026, the company stands at a critical crossroads: navigating a post-reshoring manufacturing boom while undergoing its first CEO transition in a decade. With a business model increasingly "embedded" within customer facilities through industrial vending and Onsite locations, Fastenal is no longer just selling nuts and bolts; it is selling efficiency. This article explores how a company built on frugality and local service has become a bellwether for the modern American industrial economy.

    Historical Background

    Fastenal’s story began on November 28, 1967, when Bob Kierlin and four partners—the "Fastenal Five"—opened a 1,000-square-foot storefront with just $30,000 in capital. Kierlin’s original vision was to sell fasteners through custom vending machines, a concept decades ahead of its time. When the hardware of the 1960s failed to meet his requirements, the company pivoted to a traditional retail model, focusing on high-demand local inventory and unparalleled speed.

    The company went public on August 1, 1987, at $9 per share. Despite the infamous market crash later that year, Fastenal’s IPO was a success, providing the fuel for a massive national expansion. Throughout the 1990s and early 2000s, Fastenal blanketed North America with thousands of small-town branches, often entering markets where national competitors wouldn't venture. However, the most significant historical shift occurred in 2008 and 2014, when the company revisited Kierlin’s original vending dream and launched the "Onsite" program, moving the business from the street corner to the factory floor.

    Business Model

    Fastenal operates a high-touch, technology-driven distribution model centered on three primary pillars:

    1. Onsite Locations: Instead of expecting customers to come to a retail branch, Fastenal puts a "branch" inside the customer’s facility. As of late 2024, Onsite locations (over 2,000) officially outnumbered traditional public branches. These sites are dedicated to single large customers, providing immediate inventory and technical support.
    2. Fastenal Managed Inventory (FMI): This is the company’s technological moat. It includes the FASTVend industrial vending machines and FASTBin infrared/RFID smart bins. These devices track usage in real-time, automate replenishment, and reduce customer consumption by 20–30%.
    3. Digital Footprint: Fastenal has aggressively pushed toward a "Digital Footprint," which includes e-commerce, EDI, and FMI technology. By early 2026, over 66% of the company's revenue is generated through these digital channels, significantly higher than the 10% seen a decade ago.

    Stock Performance Overview

    Fastenal has long been a "dividend aristocrat" in spirit, if not yet in official tenure.

    • 1-Year Performance: As of April 2026, the stock has climbed approximately 29.9% over the past twelve months, buoyed by the 2025 "Manufacturing Renaissance" and a successful 2-for-1 stock split in May 2025.
    • 5-Year Performance: The stock has nearly doubled, up roughly 96.6%. Investors who held through the supply chain volatility of the early 2020s were rewarded as Fastenal’s "local-first" inventory strategy proved more resilient than catalog-based competitors.
    • 10-Year Performance: Over the last decade, FAST has delivered an average annual total return of approximately 37%, consistently outperforming the S&P 500 Industrial Sector. Notable moves were seen today, April 13, 2026, with the stock experiencing a 6% pullback following a "cautious" forward outlook in the Q1 earnings report, despite beating revenue estimates.

    Financial Performance

    Fastenal’s financial profile is defined by high margins and an exceptionally clean balance sheet.

    • Earnings & Revenue: For the fiscal year 2025, Fastenal reported record net sales of $8.20 billion, an 8.7% increase year-over-year. Net income reached $1.26 billion. In its latest Q1 2026 report, revenue hit $2.20 billion, a 12.4% surge over the previous year.
    • Margins: Operating margins remain robust at 20.3% as of Q1 2026. While gross margins have seen slight compression (44.6%) due to a higher mix of large "National Account" customers who receive volume pricing, this has been offset by lower operating expenses from consolidated branches.
    • Dividends & Debt: The company recently raised its quarterly dividend to $0.24 per share, marking 13 consecutive years of increases. With a debt-to-equity ratio of just 3.2% and a Return on Invested Capital (ROIC) of 31.0%, Fastenal remains one of the most financially disciplined companies in the Russell 1000.

    Leadership and Management

    The "Blue Team" is currently undergoing its most significant leadership change in years. Daniel Florness, who joined in 1996 and became CEO in 2016, is the architect of the company’s digital transformation. Florness is known for his "Winona-style" frugality and a management philosophy of radical decentralization.

    In December 2025, the board announced that Florness will step down on July 16, 2026. He will be succeeded by Jeffery Watts, currently the President and Chief Sales Officer. Watts is a 30-year Fastenal veteran, signaling a "continuity of culture" strategy. Investors generally view this internal promotion as a sign that the company’s trajectory toward Onsites and automation will remain unchanged.

    Products, Services, and Innovations

    While fasteners still represent about 25% of sales, Fastenal has diversified into a massive array of MRO (Maintenance, Repair, and Operations) supplies, safety equipment, and metalworking tools.

    • Innovation Pipeline: Fastenal’s recent focus has been on "Edge AI" in its vending machines. These machines can now predict tool failure by analyzing usage patterns, alerting factory managers to replace a drill bit or cutting tool before it breaks on the production line.
    • Supply Chain Automation: The company has invested heavily in "native case handling" robotics within its 15 North American distribution centers, allowing for faster pallet-to-bin replenishment and maintaining its competitive advantage in local delivery speed.

    Competitive Landscape

    The industrial distribution market is a "clash of titans" with four distinct philosophies:

    • W.W. Grainger (NYSE: GWW): The leader in broad-line MRO and digital efficiency. Grainger wins on assortment and the ease of its web interface.
    • Amazon Business: The disruptor. Amazon dominates "tail-spend" (unplanned, low-volume purchases) but has historically struggled to provide the on-the-ground technical service that Fastenal offers.
    • MSC Industrial Direct (NYSE: MSM): The specialist in metalworking. MSC is Fastenal’s closest rival in technical expertise but lacks the massive "vending footprint."
    • Fastenal's Edge: Its physical proximity. By being inside the factory (Onsite), Fastenal effectively locks out competitors from the most critical daily transactions.

    Industry and Market Trends

    The "U.S. Manufacturing Renaissance" is the primary macro driver in 2026. Driven by policies like the "One Big Beautiful Bill Act" (OBBBA), over $3 trillion in reshoring investments have flowed into domestic semiconductor, EV battery, and aerospace facilities. This "just-in-case" inventory model favors distributors with physical infrastructure near these new gigafactories. Furthermore, a persistent labor shortage of 500,000 manufacturing workers has made Fastenal’s automated vending and inventory management solutions a "must-have" for labor-strapped plant managers.

    Risks and Challenges

    • Cyclicality: Fastenal is highly sensitive to the Purchasing Managers' Index (PMI). Any downturn in industrial production directly impacts SKU velocity.
    • Margin Pressure: As Fastenal wins more "National Accounts" (large multi-site companies), its gross margins naturally face pressure because these large clients demand lower prices.
    • Leadership Transition Risk: While Jeff Watts is a veteran, any change at the top introduces the risk of cultural drift or strategic misalignment during the transition period in July 2026.

    Opportunities and Catalysts

    • Onsite Expansion: Management believes the market can support over 4,000 Onsite locations, nearly double the current count. Each new Onsite represents a captured revenue stream.
    • International Growth: While 80%+ of revenue is North American, Fastenal’s European and Asian footprints are growing at a faster clip than its domestic base, providing a long-term runway for expansion.
    • M&A Potential: With virtually no debt and nearly $1 billion in annual free cash flow, Fastenal is well-positioned to acquire smaller, niche distributors in specialized fields like electrical or fluid power.

    Investor Sentiment and Analyst Coverage

    Wall Street remains generally "Overweight" on Fastenal, though the current valuation (trading at roughly 28x forward earnings) often draws skepticism from value-oriented analysts. Institutional ownership remains high at over 80%, with major holdings by Vanguard and BlackRock. Retail sentiment on platforms like FinTwit (X) often focuses on Fastenal as a "Sleep Well At Night" (SWAN) stock due to its dividend consistency and fortress balance sheet.

    Regulatory, Policy, and Geopolitical Factors

    The 2025 "Liberation Day Tariffs" on imported industrial components have made domestic supply chain reliability paramount. Fastenal’s extensive private trucking fleet (one of the largest in the U.S.) allows it to bypass many of the common logistical hurdles that plague competitors relying on third-party carriers. Additionally, new environmental regulations requiring "Carbon Footprint Tracking" for industrial supplies favor Fastenal’s digital platform, which can provide customers with detailed reports on the origin and environmental impact of every bolt and safety glove.

    Conclusion

    Fastenal Company (NASDAQ: FAST) is a testament to the power of "local" in a globalized world. By embedding itself within the customer’s four walls through technology and a dedicated "Blue Team," it has created a moat that is difficult for even the largest digital disruptors to cross. While the stock faces immediate volatility following its April 13 earnings report and the impending CEO transition, its underlying fundamentals—31% ROIC, zero debt, and a 66% digital sales mix—suggest that the company is better prepared for the 2030s than almost any other industrial peer. For the long-term investor, Fastenal remains a bedrock play on the continued revitalization of North American manufacturing.


    This content is intended for informational purposes only and is not financial advice.

  • The Radiopharmaceutical Renaissance: A Deep Dive into Telix Pharmaceuticals (TLX)

    The Radiopharmaceutical Renaissance: A Deep Dive into Telix Pharmaceuticals (TLX)

    As of April 13, 2026, Telix Pharmaceuticals Limited (ASX: TLX; NASDAQ: TLX) stands as a pivotal player in the rapidly evolving field of radiopharmaceuticals—a sector that has transformed from a niche oncology sub-specialty into a multi-billion-dollar cornerstone of precision medicine. Headquartered in Melbourne, Australia, with a significant and growing footprint in the United States and Europe, Telix has successfully navigated the transition from a clinical-stage biotech to a commercial powerhouse.

    The company is currently in a high-stakes phase of its lifecycle. Following a volatile 2025 marked by regulatory hurdles and a landmark NASDAQ listing, Telix is once again in the spotlight. Just days ago, on April 10, 2026, the U.S. Food and Drug Administration (FDA) accepted the resubmitted New Drug Application (NDA) for its brain cancer imaging agent, Pixclara™, signaling a potential new revenue stream. This article explores whether Telix’s ambitious "vertical integration" strategy and its aggressive pipeline expansion can sustain its status as a market leader in the face of intensifying competition from pharmaceutical giants.

    Historical Background

    Founded in November 2015 by Dr. Christian Behrenbruch and Dr. Andreas Kluge, Telix was built on the premise that "theranostics"—the combination of molecular imaging (diagnostics) and targeted radiation (therapeutics)—would redefine cancer care. The company listed on the Australian Securities Exchange (ASX) in November 2017, raising A$50 million at just A$0.65 per share.

    The defining moment in Telix’s history occurred in December 2021, when it received FDA approval for Illuccix®, its lead product for prostate cancer imaging. This approval catalyzed a period of hyper-growth, as Telix successfully challenged incumbent diagnostic providers in the U.S. market. Between 2022 and 2024, the company engaged in a flurry of strategic acquisitions—including Lightpoint Medical, ARTMS Inc., and the landmark January 2025 acquisition of RLS Radiopharmacies—to secure its own isotope production and distribution network. In November 2024, Telix achieved a dual-listing milestone by debuting on the NASDAQ, cementing its arrival on the global stage.

    Business Model

    Telix operates a vertically integrated business model centered on the "Theranostic" cycle. Its revenue is derived from three primary segments:

    1. Precision Medicine (Diagnostics): This is the current core revenue driver. Product sales of Illuccix® (and its next-generation successor Gozellix®) provide high-margin cash flow. These PET imaging agents allow clinicians to detect cancer with high specificity, which then informs the use of targeted therapies.
    2. Therapeutics: While mostly in the clinical stage, this segment represents the company’s long-term value. Telix is developing "radioligand" therapies that deliver radiation directly to cancer cells, minimizing damage to healthy tissue.
    3. Manufacturing and Distribution (TMS): Through the RLS acquisition, Telix now operates the largest independent radiopharmaceutical distribution network in the U.S. While this segment operates at lower margins than drug development, it provides a strategic "moat," ensuring Telix can deliver its short-lived radioactive products to hospitals within the critical hours required for patient use.

    Stock Performance Overview

    Telix’s stock has been a "multibagger" for early investors, though recent years have tested the resolve of shareholders.

    • 1-Year Performance: The past 12 months have been a roller coaster. After hitting an all-time high of approximately A$20.93 in early 2025, the stock faced a significant correction—losing nearly 50% of its value at one point—following a "Complete Response Letter" (CRL) from the FDA regarding its kidney cancer imaging agent, Zircaix®. However, as of April 2026, the stock has rebounded to the A$14.00–A$15.00 range, buoyed by progress on its brain cancer pipeline.
    • 5-Year Performance: Telix remains one of the top performers on the ASX 200 Healthcare index, significantly outperforming broader market benchmarks as it moved from a A$3.00 stock in 2021 to its current double-digit valuation.
    • 10-Year/Long-term: Since its 2017 IPO, the stock has returned over 1,500%, reflecting its successful commercialization of Illuccix.

    Financial Performance

    In the 2025 fiscal year, Telix reported total revenue of US$803.8 million, a staggering 56% increase year-over-year. This growth was primarily fueled by continued market share gains in the U.S. prostate cancer imaging market.

    Despite the revenue surge, the company reported a modest net loss of US$7.1 million for FY2025. This was a deliberate strategic choice; Telix reinvested US$171.2 million into Research & Development (R&D) and incurred significant integration costs for the RLS pharmacy network. Management has guided for FY2026 revenue between US$950 million and US$970 million, with a clear path back to profitability as the Zircaix and Pixclara products approach potential commercial launch. The balance sheet remains robust, with sufficient cash reserves to fund the Phase 3 "ProstACT Global" therapeutic trial.

    Leadership and Management

    The company is led by co-founder Dr. Christian Behrenbruch, whose background in both engineering and medicine has shaped Telix's technical and aggressive M&A strategy. Behrenbruch is known for his fast-paced execution and "founder-led" intensity, which has garnered both admiration and occasional scrutiny from conservative analysts.

    In early 2026, the board was strengthened by the appointment of David Gill as Chair. Gill, a veteran of the U.S. medical device and biotech industries, brings deep experience in navigating NASDAQ-listed companies and institutional investor relations. This transition signals Telix's maturation from an Australian "success story" into a sophisticated global pharmaceutical entity.

    Products, Services, and Innovations

    Telix’s product portfolio is expanding beyond its initial focus on prostate cancer:

    • Illuccix® / Gozellix®: The "gold standard" for PSMA PET imaging in prostate cancer.
    • Pixclara™ (TLX101-Px): A diagnostic agent for glioma (brain cancer). With the FDA’s NDA acceptance on April 10, 2026, and a PDUFA (action) date set for September 11, 2026, this is the company's most immediate catalyst.
    • Zircaix® (TLX250-CDx): Targeted at clear cell renal cell carcinoma (kidney cancer). Despite a manufacturing-related setback in 2025, Telix is currently finalizing its resubmission to the FDA.
    • TLX591: A Phase 3 radioligand therapy for prostate cancer. Unlike competitors that use small molecules, TLX591 uses a monoclonal antibody, which may offer a more patient-friendly dosing schedule.

    Competitive Landscape

    Telix operates in an increasingly crowded arena. Its primary rivals include:

    • Novartis (NVS): The global leader in radioligand therapy with Pluvicto® and Lutathera®. Novartis has the balance sheet to dominate the therapeutic space, but Telix aims to compete on product differentiation and better delivery logistics.
    • Lantheus (LNTH): The main competitor in the diagnostic space. Lantheus’s Pylarify® currently holds the largest share of the U.S. market, though Telix has consistently eroded this lead through its "Illuccix" brand.
    • Bayer and Point Biopharma (Eli Lilly): Both have significant programs in the pipeline, making the radiopharmaceutical sector one of the most competitive in oncology.

    Industry and Market Trends

    The industry is experiencing a "Radiopharmaceutical Renaissance." Historically, radioactive drugs were limited by supply chain complexity and a lack of specialized clinicians. However, the success of therapies like Pluvicto has proven that radioligand therapy can be a multi-billion-dollar blockbusters.
    Key trends include:

    • Theranostics: The shift toward "see what you treat," where imaging is mandatory before therapy.
    • Decentralized Manufacturing: Moving isotope production closer to the patient using cyclotrons (like Telix’s ARTMS technology) rather than relying solely on aging nuclear reactors.
    • Alpha Therapies: A shift from Beta-emitters (like Lutetium-177) to more powerful Alpha-emitters (like Actinium-225), an area where Telix is investing heavily.

    Risks and Challenges

    Investors must weigh Telix’s growth against several critical risks:

    1. Regulatory Risk: As evidenced by the 2025 Zircaix CRL, the FDA is increasingly stringent regarding Chemistry, Manufacturing, and Controls (CMC) for radioactive products. Any further delays in the Pixclara or Zircaix pipelines would be detrimental.
    2. Isotope Supply: The world faces a chronic shortage of medical isotopes. While Telix has diversified its supply, any disruption in nuclear reactor schedules or logistics can halt revenue overnight.
    3. Margin Compression: The acquisition of the RLS distribution network, while strategic, brings a lower-margin profile to the group, which could weigh on overall valuation multiples if not managed efficiently.

    Opportunities and Catalysts

    • September 11, 2026: The PDUFA date for Pixclara. Approval would mark Telix’s entry into neuro-oncology.
    • Zircaix Resubmission: Expected in the coming months, this could de-risk the company's second major diagnostic pillar.
    • China Market: The recent acceptance of the NDA for its prostate imaging agent in China opens a massive, under-served market.
    • M&A Target: Given the consolidation in the sector (e.g., AstraZeneca and Eli Lilly's recent acquisitions), Telix itself remains a perennial takeover candidate for a Big Pharma player looking for a turn-key radiopharmaceutical platform.

    Investor Sentiment and Analyst Coverage

    Sentiment among Wall Street and ASX analysts remains bullish. Currently, approximately 75% of analysts cover the stock with a "Strong Buy" or "Buy" rating. Consensus price targets generally sit between A$18.00 and A$20.00, suggesting significant upside from current levels. Institutional ownership has stabilized at 35–40%, with heavyweights like Fidelity and JPMorgan increasing their positions following the NASDAQ listing. Retail sentiment is more cautious, still wary after the 2025 volatility, but the recent Pixclara news has reinvigorated interest.

    Regulatory, Policy, and Geopolitical Factors

    Radiopharmaceuticals are subject to a unique "triple-regulatory" burden: the FDA (for drug safety), the Nuclear Regulatory Commission (for radioactive material handling), and the Department of Transportation (for hazardous material transport).
    Furthermore, the U.S. "Find It, Early Act" and other reimbursement policies regarding PET scans are tailwinds for Telix, as they improve patient access to high-end diagnostics. Geopolitically, the reliance on a few global nuclear reactors for isotopes (some in Europe and Africa) makes the supply chain sensitive to international relations and energy policy.

    Conclusion

    Telix Pharmaceuticals is at a defining crossroads. It has successfully evolved from a research project into a US$800M+ revenue-generating entity with a unique, vertically integrated footprint in the U.S. market. While the regulatory setbacks of 2025 served as a sobering reminder of the risks inherent in biotech, the recent FDA acceptance of Pixclara suggests that the company’s "Precision Medicine" engine is firing again.

    For investors, Telix offers a rare combination of commercial-stage revenue and a deep, "moonshot" therapeutic pipeline. The key for the remainder of 2026 will be the flawless execution of its manufacturing strategy and the successful navigation of the September FDA decision. If Telix can prove that it can repeatedly clear regulatory hurdles while maintaining its distribution moat, it may well become the definitive leader of the radiopharmaceutical era.


    This content is intended for informational purposes only and is not financial advice.