Blog

  • Tesla, Inc. (TSLA): The Great Metamorphosis from EV Giant to AI Powerhouse

    Tesla, Inc. (TSLA): The Great Metamorphosis from EV Giant to AI Powerhouse

    As of January 28, 2026, Tesla, Inc. (NASDAQ: TSLA) finds itself at the most critical juncture in its 23-year history. Once the undisputed leader of the global electric vehicle (EV) revolution, the Austin-based titan is currently navigating a fundamental identity shift. The narrative has pivoted from scaling vehicle production to a high-stakes bet on artificial intelligence, autonomous transport, and energy storage. While Tesla’s market capitalization remains at a staggering $1.4 trillion—dwarfing all other automakers combined—the underlying business is undergoing a painful transformation. With vehicle delivery growth slowing and competition from China reaching a fever pitch, the focus of the investment community has shifted entirely to the upcoming rollout of the "Cybercab" and the realization of "Unsupervised" Full Self-Driving (FSD).

    Historical Background

    Founded in 2003 by Martin Eberhard and Marc Tarpenning—and later revolutionized by Elon Musk—Tesla's journey has been defined by audacity. From the launch of the original Roadster in 2008 to the "production hell" of the Model 3 in 2017-2018, the company has survived multiple brushes with bankruptcy to become the most valuable automaker in history.

    Tesla's "Master Plan" has been the roadmap for this journey. Part 1 focused on expensive low-volume cars to fund affordable high-volume cars. Part Deux emphasized autonomy and energy. Part 3, released in 2023, focused on a "sustainable energy economy." However, by late 2025, it became clear that Tesla was entering its fourth phase: a total convergence of automotive hardware with robotics and neural network-based AI. The company’s ability to scale Giga Shanghai and Giga Berlin has proven its manufacturing prowess, but the historical narrative is now shifting from the "car company" of the 2010s to the "AI powerhouse" of the late 2020s.

    Business Model

    Tesla operates a vertically integrated business model that spans multiple industries. Its primary revenue segments include:

    1. Automotive Sales & Leasing: Though growth has tempered, the Model Y and Model 3 remain the world’s top-selling EVs. Revenue is also derived from regulatory credits sold to other automakers.
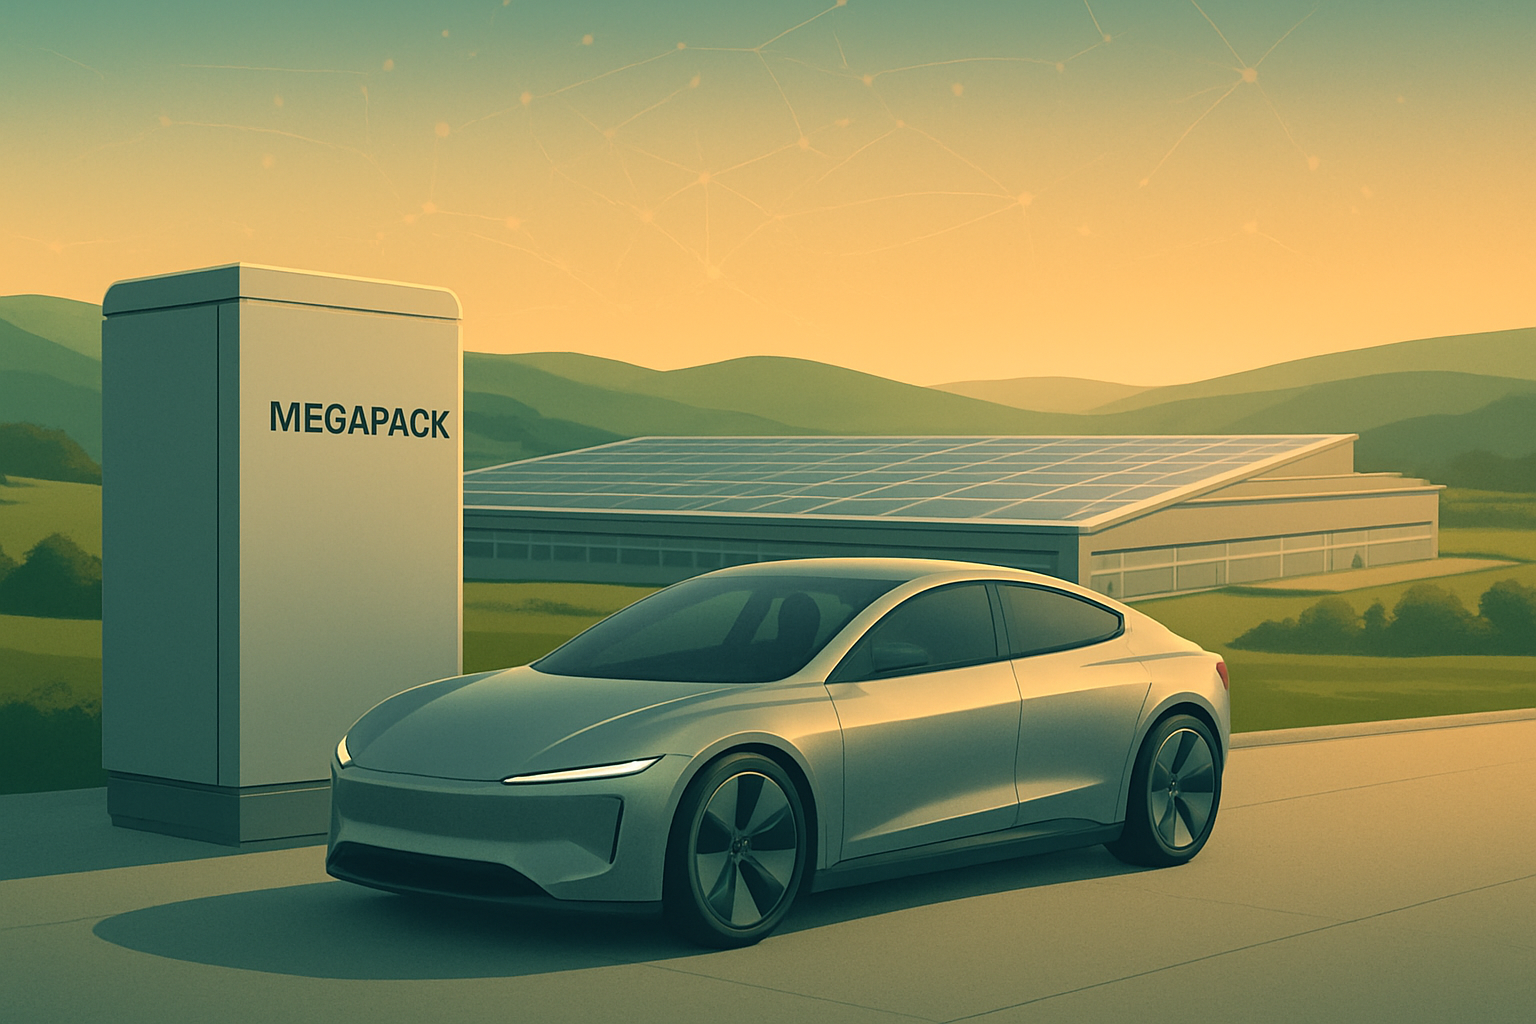
    2. Energy Generation & Storage: This has become Tesla’s fastest-growing segment. Through products like the Megapack and Powerwall, Tesla provides grid-scale and residential energy solutions. In 2025, this segment deployed a record 46.7 GWh of storage.
    3. Services & Other: This includes the global Supercharger network (now largely opened to non-Tesla vehicles), vehicle insurance, and aftermarket repairs.
    4. Software (FSD): A high-margin recurring revenue stream via monthly subscriptions or one-time purchases of Tesla's autonomous driving suite.

    The hallmark of Tesla’s model is its direct-to-consumer sales, bypassing traditional dealerships, and its "unboxed" manufacturing process designed to drastically reduce costs.

    Stock Performance Overview

    Tesla’s stock performance continues to be a polarizing "tale of two tapes." As of January 28, 2026, the stock is trading near $432 per share.

    • 1-Year Performance: TTM returns sit at approximately 8.5%. The stock saw significant volatility throughout 2025, dipping into the $200s due to earnings misses before a massive rally in Q4 fueled by Robotaxi excitement.
    • 5-Year Performance: Investors have seen a roughly 50% return, a figure tempered by the massive correction in 2022 and the stagnation of 2024.
    • 10-Year Performance: Tesla remains a "generational" winner, with a 10-year return exceeding 3,300%. An investment of $10,000 in January 2016 would be worth over $340,000 today.

    The current valuation reflects a "future-dated" premium, as Tesla's Price-to-Earnings (P/E) ratio sits at an eye-watering 287x, suggesting the market is pricing in near-total dominance of the future autonomous taxi market.

    Financial Performance

    The fiscal year 2025 was widely characterized as a "bridge year." The financial data reveals the strain of Tesla's transition:

    • Deliveries & Revenue: Full-year 2025 deliveries reached 1.63 million vehicles, an 8.6% decline from 2024. This contraction was driven by high interest rates and the aging of the Model 3/Y lineup.
    • Margins: Automotive gross margins (excluding credits) hovered around 16.5%, down from the 25%+ peaks of 2022. The aggressive price wars in China and the U.S. have significantly dented the "Apple-like" margins Tesla once enjoyed.
    • Energy Storage: The star performer of 2025. Revenue from energy exceeded $12 billion, with the segment reaching higher operating margins than the automotive division for the first time.
    • Cash Position: Tesla maintains a fortress balance sheet with over $30 billion in cash and investments, allowing it to fund a projected $11 billion in 2026 CapEx for its "Cortex" AI supercluster.

    Leadership and Management

    Elon Musk remains the central figure, serving as CEO, "Technoking," and chief strategist. However, 2024 and 2025 saw a notable "brain drain" of senior talent. The departures of Drew Baglino (Powertrain), David Lau (Software), and Pete Bannon (Hardware) have raised concerns about executive stability.

    To counter these worries, Tesla added John R. "Jack" Hartung to the board in June 2025, bringing disciplined financial oversight. Despite the executive churn, Musk’s focus has narrowed intensely on the "Optimus" humanoid robot and the "Cybercab" project, often leading to a culture of high-intensity, mission-driven work that attracts top-tier AI talent from Silicon Valley.

    Products, Services, and Innovations

    Tesla’s product roadmap is currently in its most ambitious phase:

    • The Cybercab: A purpose-built, steering-wheel-less autonomous vehicle. Initial production is slated for April 2026 at Giga Texas.
    • The Affordable Model (NV-91): Often called the "Model 2," this $25,000 vehicle is expected to begin volume production by mid-2026. It utilizes the "unboxed" manufacturing method, which treats the car like Lego-like modules to speed up assembly.
    • FSD v13/v14: Tesla's software has moved to a purely "end-to-end" neural network, removing millions of lines of human-written code. The company is currently testing "Unsupervised" FSD in Texas and California.
    • Optimus: Tesla’s humanoid robot is already performing basic tasks in its factories. Musk has guided for external sales to begin in late 2026 or 2027.

    Competitive Landscape

    The competitive environment has shifted from "Tesla vs. The World" to "Tesla vs. China."

    • BYD (SZSE: 002594): In 2025, BYD officially dethroned Tesla as the world's largest BEV manufacturer by volume, delivering 2.26 million units. BYD’s vertical integration in battery production gives it a cost advantage that Tesla is struggling to match.
    • Xiaomi (HKEX: 1810): The smartphone giant has become a massive threat. Its SU7 sedan outsold the Model 3 in China in 2025, offering superior tech integration at a lower price point.
    • Legacy OEMs: Ford (NYSE: F) and GM (NYSE: GM) have pulled back on EV targets, pivoting to hybrids. This has left Tesla with less competition in the U.S. but more pressure to defend its market share against cheaper, more varied Chinese imports globally.

    Industry and Market Trends

    The EV industry is currently grappling with a "trough of disillusionment." High entry prices and "range anxiety" have cooled demand among the early majority. However, the shift toward Software-Defined Vehicles (SDVs) is the dominant trend for 2026.

    Additionally, the Energy Storage market is entering a hyper-growth phase as global power grids struggle to handle renewable energy intermittency. Tesla’s Megapack is currently the industry standard, and with the Lathrop and Shanghai Megafactories at full tilt, Tesla is arguably more of a grid-infrastructure company than a car company in the current macro climate.

    Risks and Challenges

    • Execution Risk: Tesla has a history of missed timelines. Any delay in the April 2026 Cybercab launch could lead to a massive stock de-rating.
    • Regulatory Hurdles: "Unsupervised" FSD requires a patchwork of state and federal approvals. While Texas is friendly, other jurisdictions remain skeptical of camera-only (vision) autonomy.
    • China Exposure: With nearly 40% of its production and a significant portion of its profits tied to China, Tesla is highly vulnerable to geopolitical tensions and the ongoing price war initiated by BYD.
    • Valuation Paradox: Trading at 287x earnings while car sales are shrinking creates a precarious "perfection-priced" environment.

    Opportunities and Catalysts

    • The Robotaxi Network: If Tesla successfully launches a ride-hailing app (the "Tesla Network"), it could unlock trillions in high-margin software revenue.
    • FSD Licensing: Musk has hinted at ongoing talks with major OEMs to license FSD. A single deal could validate Tesla’s software as the "Windows" of autonomous driving.
    • Federal AV Act: Rumors of a federal U.S. mandate for autonomous vehicle standards in late 2026 could provide the regulatory "green light" Tesla needs to scale nationally.
    • Energy Margin Expansion: As battery cell costs fall, the Megapack business is expected to maintain 25%+ margins, providing a stable cash floor for the more volatile AI projects.

    Investor Sentiment and Analyst Coverage

    Wall Street is fundamentally divided on TSLA:

    • The Bulls (e.g., Wedbush): Focus on the "sum of the parts" valuation. They argue that the AI/Robotics business alone is worth $1 trillion, and the auto business is merely the "delivery mechanism."
    • The Bears (e.g., Wells Fargo): Argue that Tesla is a "growth company without growth" in its core business. They point to the 16% decline in Q4 2025 deliveries as evidence that the "EV bubble" has popped.
    • Retail Sentiment: Remains fiercely loyal. Tesla continues to be one of the most widely held stocks by retail investors, often buoying the price during institutional sell-offs.

    Regulatory, Policy, and Geopolitical Factors

    The geopolitical landscape for 2026 is fraught with difficulty. In the United States, policy shifts regarding EV tax credits (IRA) and potential tariffs on Chinese components remain fluid. Globally, the European Union's anti-subsidy probe into Chinese EVs has inadvertently benefited Tesla’s made-in-Germany vehicles, but the company faces rising labor pressure in Nordic countries.

    In China, Tesla remains the only foreign automaker with a wholly-owned factory, but the "data security" concerns surrounding FSD testing have led to periodic bans of Tesla vehicles from government sites—a trend that must be reversed for FSD to succeed in the world’s largest car market.

    Conclusion

    Tesla enters 2026 as a company in the midst of a metamorphosis. Its days as a high-growth "hyper-scaler" of mass-market cars are, for now, on hiatus. The 2025 delivery contraction serves as a sobering reminder that the transition to electric mobility is not a linear path.

    However, by aggressively pivoting to AI and energy storage, Tesla has managed to maintain a valuation that defies traditional automotive logic. Investors must decide if they are buying a car company—in which case TSLA is wildly overvalued—or if they are buying the world’s most advanced robotics lab. The next 12 months, headlined by the April 2026 Cybercab launch, will determine which side of that debate is correct. For now, Tesla remains a high-beta, high-reward play on the future of autonomy, requiring a stomach for volatility and a long-term belief in the "Master Plan."


    This content is intended for informational purposes only and is not financial advice. Today's date: January 28, 2026.

  • The Intelligence Utility: A Deep Dive into Meta Platforms (META) in 2026

    The Intelligence Utility: A Deep Dive into Meta Platforms (META) in 2026

    Date: January 28, 2026

    Introduction

    As we enter the early weeks of 2026, Meta Platforms, Inc. (NASDAQ: META) finds itself at a pivotal crossroads that echoes the magnitude of its 2021 rebranding. No longer just a social media conglomerate, the company has spent the last year aggressively repositioning itself as an "intelligence utility." Under the relentless leadership of Mark Zuckerberg, Meta has transitioned from the cost-cutting "Year of Efficiency" in 2023 into a high-stakes "Era of Infrastructure" in 2025 and 2026. With a market capitalization fluctuating near the $2 trillion mark, the company is now defined by a dual-track strategy: defending its massive advertising moat through generative AI while spending unprecedented billions to win the race for Artificial General Intelligence (AGI).

    Historical Background

    Founded in 2004 in a Harvard dorm room, the company then known as Facebook has undergone three distinct "lives." Its first decade was defined by the transition from desktop to mobile and the strategic acquisitions of Instagram (2012) and WhatsApp (2014), which cemented its dominance in global communications. Its second era, roughly from 2016 to 2021, was marked by massive scaling alongside intense regulatory scrutiny over privacy and election integrity.

    The third and current era began in late 2021 with the rebranding to Meta Platforms. This move signaled a shift toward the "Metaverse," a vision that initially met with investor skepticism and a precipitous stock price drop in 2022. However, the subsequent pivot in late 2023 toward "Efficiency" and a primary focus on AI has revitalized the company. Today, Meta is as much a hardware and semiconductor powerhouse as it is a social network, owning one of the world’s largest clusters of H100 and B200 GPUs.

    Business Model

    Meta’s business model remains a two-speed engine. The Family of Apps (FoA) segment—comprising Facebook, Instagram, Messenger, and WhatsApp—is the core profit driver, accounting for over 98% of total revenue. This segment generates cash through highly targeted digital advertising, increasingly powered by "Advantage+" AI tools that automate ad creation and placement.

    The Reality Labs (RL) segment represents the company’s long-term bet on the future of computing. While currently deep in the red, RL focuses on augmented reality (AR), virtual reality (VR), and the "Meta AI" software ecosystem. In 2025, Meta significantly diversified this segment's strategy, moving away from pure VR headsets like the Quest toward "wearable AI," such as its highly successful collaboration with Luxottica on the Ray-Ban Meta smart glasses.

    Stock Performance Overview

    Meta’s stock performance has been a roller coaster of historic proportions.

    • 1-Year Performance (2025): Through 2025, META shares gained approximately 13.7%. While it lagged the broader Nasdaq 100’s 21% surge, the stock showed remarkable resilience, recovering from a mid-year dip as investors grew comfortable with the company's massive capital expenditure (CapEx) plans.
    • 5-Year Performance (2021–2026): Looking back five years to January 2021, the stock has risen from roughly $270 to its current levels near $600, a gain of over 120%. This period includes the catastrophic 75% drawdown of 2022, making its recovery one of the most significant "rebound stories" in Big Tech history.
    • 10-Year Performance (2016–2026): For the long-term holder, the story is one of consistent compounding. From a price of approximately $100 in early 2016, the stock has delivered a 6x return, outperforming the S&P 500 by a wide margin.

    Financial Performance

    In FY 2025, Meta broke revenue records, reaching approximately $200 billion for the full year. This 20-25% year-over-year growth was driven by a robust digital ad market and the full monetization of Reels, which now commands a $50 billion annual revenue run rate.

    However, the "Efficiency" of 2023 has given way to the "Expansion" of 2025. CapEx for 2025 hit a staggering $71 billion, and guidance for 2026 suggests spending could reach $100 billion. Net income remains strong at roughly $55 billion, but operating margins have felt the squeeze, narrowing from the 40% range in late 2024 to approximately 34% by the end of 2025 as the company builds out massive "Meta Compute" centers.

    Leadership and Management

    Mark Zuckerberg remains the undisputed architect of Meta’s destiny, holding majority voting control through dual-class shares. In 2025, Zuckerberg adopted what insiders call "Founder Mode"—a more hands-on approach to technical AI development.

    To manage the company's growing geopolitical and financial complexity, Meta recently appointed Dina Powell McCormick as President and Vice Chair. Her role is critical as Meta navigates the multi-trillion-dollar sovereign wealth environment needed to fund its infrastructure. Meanwhile, CTO Andrew "Boz" Bosworth continues to lead the hardware charge, though the focus has shifted from "Metaverse-first" to "AI-first."

    Products, Services, and Innovations

    The star of the 2025 product lineup was Llama 4, the company’s latest open-source LLM. While it faced stiff competition from Google and OpenAI, Llama 4 has become the industry standard for enterprise developers.

    In hardware, the Ray-Ban Meta smart glasses became a "surprise hit," with over 2 million units sold in 2025. The latest "Ray-Ban Meta Display" ($799), featuring a monocular AR overlay and a neural wristband for gesture control, has bridged the gap between fashion and functional computing. Behind the scenes, the high-end Orion AR glasses remain a "north star" prototype, with a consumer version (Artemis) expected in 2027.

    Competitive Landscape

    Meta faces a three-front war:

    1. Alphabet (NASDAQ: GOOGL): Competing for the AI-driven search and advertising crown.
    2. TikTok (owned by ByteDance): While regulatory pressure has hampered TikTok’s growth in the US, it remains Meta's primary rival for "attention share" among Gen Z.
    3. Apple (NASDAQ: AAPL): Apple’s Vision Pro and ecosystem privacy controls continue to be a thorn in Meta's side, though Meta’s move into "affordable" AI glasses has carved out a niche Apple has yet to dominate.

    Industry and Market Trends

    The primary trend in 2026 is the commoditization of intelligence. As AI models become more powerful, the value is shifting from the models themselves to the distribution and the compute. Meta’s massive user base (over 4 billion monthly active users) gives it a distribution advantage that pure-play AI companies like OpenAI lack. Additionally, the industry is seeing a shift toward "Visual Intelligence"—the ability for AI to see and react to the world in real-time through camera-equipped wearables.

    Risks and Challenges

    The "elephant in the room" is the ROI on CapEx. If the massive investments in AI infrastructure do not lead to a proportional increase in ad revenue or new subscription streams by 2027, investors may lose patience.

    Operationally, Reality Labs continues to lose nearly $20 billion annually. While the core business can afford this today, any significant macro downturn could make these losses unsustainable. Furthermore, the reliance on NVIDIA (NASDAQ: NVDA) for GPUs remains a significant supply-chain concentration risk.

    Opportunities and Catalysts

    The immediate catalyst for 2026 is the monetization of WhatsApp. For years, WhatsApp was the "sleeping giant" of Meta’s portfolio. With the rollout of AI-driven business messaging and "click-to-WhatsApp" ads, the platform is finally becoming a major revenue contributor.

    Another opportunity lies in Project Avocado and Project Mango—Meta’s secretive next-gen models focused on "human-level reasoning" and visual understanding. If these models achieve the "Superintelligence" benchmarks Zuckerberg has hinted at, Meta could pivot into a B2B AI cloud provider, competing directly with AWS or Azure.

    Investor Sentiment and Analyst Coverage

    Wall Street maintains a "Strong Buy" consensus on META as of January 2026. High-conviction price targets range from $670 to $900. Institutional investors, including Vanguard and BlackRock, have maintained their overweight positions, citing Meta’s "reasonable" P/E ratio relative to its AI growth potential. Retail sentiment remains bullish, buoyed by the success of the Ray-Ban Meta glasses, which provided a tangible consumer "win" for the company’s hardware division.

    Regulatory, Policy, and Geopolitical Factors

    Regulatory headwinds are the primary "tail risk." In January 2026, the FTC filed a formal appeal against a previous court ruling that had cleared Meta of monopoly charges. A forced breakup of Instagram or WhatsApp remains a low-probability but high-impact risk.

    In Europe, the Digital Markets Act (DMA) has forced Meta to offer "less personalized ads," which may slightly erode ARPU (Average Revenue Per User) in the region. Geopolitically, the race for AI supremacy has made Meta a "national champion" for the U.S., which may offer some protection against aggressive domestic antitrust actions.

    Conclusion

    Meta Platforms enters 2026 as a company of immense contradictions: it is a legacy social media giant that is also a cutting-edge AI pioneer; it is a cash-flow machine that is spending its profits as fast as it earns them.

    For investors, the thesis for 2026 rests on one question: Can Meta’s AI-driven ad efficiency grow fast enough to fund its AGI ambitions? If the Ray-Ban Meta glasses are any indication, Zuckerberg’s bet on "wearable intelligence" is finding its footing. However, with $100 billion in projected CapEx on the horizon, the margin for error has never been thinner. Investors should watch for the Q1 2026 results to see if the revenue growth from AI-enhanced messaging and Reels can keep pace with the massive build-out of the "Meta Compute" era.


    This content is intended for informational purposes only and is not financial advice.

  • Microsoft (MSFT) Deep Dive: Navigating the $100 Billion AI Infrastructure Cycle

    Microsoft (MSFT) Deep Dive: Navigating the $100 Billion AI Infrastructure Cycle

    Today, January 28, 2026, Microsoft Corporation (NASDAQ: MSFT) stands at perhaps the most significant crossroads in its half-century history. As the company prepares to release its fiscal second-quarter 2026 earnings after the bell, the global investment community is no longer just looking for growth; they are looking for the "AI payoff." After three years of unprecedented capital allocation toward artificial intelligence, Microsoft is the primary proxy for the health of the entire digital economy. This deep-dive exploration analyzes how the Redmond giant has positioned itself as the foundational layer of the next industrial revolution, and whether its current valuation can withstand the gravity of a $100 billion annual infrastructure bill.

    Historical Background

    The story of Microsoft is one of three distinct epochs. Founded in 1975 by Bill Gates and Paul Allen, the company’s first era was defined by the democratization of computing via the Windows operating system and the Office suite. By the late 1990s, Microsoft had become the most valuable company in the world, though its dominance eventually led to a decade-long antitrust battle with the U.S. government.

    The second era, often referred to as the "Lost Decade" under Steve Ballmer (2000–2014), saw the company struggle to adapt to the mobile revolution dominated by Apple Inc. (NASDAQ: AAPL) and Google—Alphabet Inc. (NASDAQ: GOOGL). While Microsoft remained highly profitable, its stock price stagnated as it failed to capture the smartphone or search markets.

    The third and current era began in 2014 with the appointment of Satya Nadella. Nadella orchestrated a masterful pivot toward "Cloud First, Mobile First," transforming Microsoft from a software vendor into a cloud powerhouse via Azure. By 2023, Microsoft entered its fourth act: the "AI First" era. Through a strategic and controversial multi-billion dollar partnership with OpenAI, Microsoft effectively outmaneuvered rivals to lead the generative AI race, a lead it has maintained into 2026.

    Business Model

    Microsoft’s business model is a diversified engine grouped into three primary segments:

    1. Intelligent Cloud: This is the company’s crown jewel, encompassing Azure, GitHub, and server products. In 2026, this segment is the primary beneficiary of AI spending, as enterprises shift their workloads to Azure to leverage AI models.
    2. Productivity and Business Processes: This includes the Office 365 ecosystem, LinkedIn, and Dynamics 365. The core strategy here is "upselling" AI through Microsoft 365 Copilot, charging a premium for AI-enhanced productivity tools.
    3. More Personal Computing: This segment covers Windows, Surface devices, and Gaming (Xbox). Following the 2023 acquisition of Activision Blizzard, Microsoft has become one of the world's largest gaming publishers, leveraging a subscription model (Game Pass) to stabilize traditionally cyclical hardware revenue.

    Stock Performance Overview

    Microsoft has been one of the most consistent wealth creators of the last decade.

    • 1-Year Performance: Over the past 12 months, MSFT has seen a robust ~22% gain, outperforming the S&P 500 but trailing some of its hardware-focused peers like NVIDIA Corporation (NASDAQ: NVDA) as the market shifted focus from AI "picks and shovels" to software implementation.
    • 5-Year Performance: The stock has more than tripled in value since early 2021, driven by the massive expansion of cloud margins and the initial AI boom.
    • 10-Year Performance: Long-term shareholders have seen returns exceeding 1,000%, a testament to Nadella’s transformative leadership and the company’s ability to generate massive free cash flow.

    As of today, Microsoft’s market capitalization remains firmly above $3.5 trillion, locked in a perpetual battle with Apple and Nvidia for the title of the world's most valuable public company.

    Financial Performance

    Heading into the Q2 FY2026 earnings report on January 28, 2026, the financial picture is one of immense scale shadowed by rising costs.

    • Revenue & EPS: Consensus estimates forecast revenue of approximately $80.3 billion for the quarter, a 15% year-over-year increase. Earnings per share (EPS) are expected to land between $3.86 and $3.97.
    • The CAPEX Conundrum: The most scrutinized figure will be Capital Expenditure. Microsoft’s annual CAPEX run-rate has reached a staggering $100 billion. This spending is necessary to build the "AI Factories" (data centers) required for the next generation of models.
    • Margins: This heavy investment is beginning to bite. Cloud gross margins, which once sat comfortably above 70%, are projected to compress to roughly 66% in Q2 FY2026. This 400-500 basis point contraction year-over-year is the "price of entry" for AI dominance, but it remains a point of friction for some investors.

    Leadership and Management

    Satya Nadella remains at the helm, widely regarded as one of the greatest CEOs of the 21st century. His leadership style—characterized by "empathy" and "growth mindset"—has been credited with dismantling the toxic internal silos of the early 2000s.

    Supporting Nadella is CFO Amy Hood, whose disciplined fiscal management has allowed Microsoft to maintain a AAA credit rating while spending tens of billions on acquisitions and R&D. In 2024, the company further bolstered its AI leadership by hiring Mustafa Suleyman (co-founder of DeepMind) to lead the newly formed Microsoft AI division, signaling a long-term commitment to consumer-facing AI products.

    Products, Services, and Innovations

    The product roadmap in 2026 is centered on "Agentic AI." While 2024 was the year of the "Chatbot," 2026 is the year of the "Agent."

    • Microsoft Agent 365: A new suite of autonomous agents that can execute entire workflows—such as processing insurance claims or managing supply chain logistics—without human intervention.
    • Azure AI Foundry: A platform that allows developers to customize and deploy multiple models (including OpenAI’s o1 and o2, Llama 4, and Microsoft’s own Phi-series small language models).
    • Sovereign Cloud: Responding to global privacy concerns, Microsoft has launched specialized cloud regions for governments and heavily regulated industries, ensuring data residency and local control.

    Competitive Landscape

    Microsoft competes on multiple fronts against the most well-capitalized firms in history:

    • Cloud Infrastructure: Amazon.com Inc. (NASDAQ: AMZN) remains the market leader in pure cloud market share, but Azure is growing faster, particularly in AI-specific workloads.
    • Search and Advertising: While Microsoft’s Bing (integrated with AI) has gained some share, Google still dominates the global search market.
    • Enterprise Software: Salesforce Inc. (NYSE: CRM) and Oracle Corporation (NYSE: ORCL) are formidable rivals in the CRM and ERP space, though Microsoft’s integration across the entire "stack" provides a unique competitive advantage.

    Industry and Market Trends

    The "AI Diffusion" trend is the macro driver for 2026. After years of testing AI in silos, large enterprises are now moving toward full-scale deployment. This is creating a massive secondary wave of demand for cloud compute. Additionally, there is a growing trend toward "Hybrid AI," where workloads are split between massive centralized data centers and localized "Edge" devices like AI PCs (Copilot+ PCs), a category Microsoft is aggressively defending.

    Risks and Challenges

    • AI Return on Investment (ROI): The greatest risk is that the massive $100 billion annual investment fails to yield a proportional increase in revenue. If enterprise productivity gains from AI do not materialize as expected, Microsoft faces a "lost decade" of margin recovery.
    • The OpenAI Relationship: The FTC and EU are currently investigating whether Microsoft’s relationship with OpenAI constitutes a "de-facto merger." Any forced divestiture or model-sharing mandate could jeopardize Microsoft's technological lead.
    • Hardware Bottlenecks: Continued reliance on high-end GPUs from Nvidia and power grid constraints in major data center hubs (like Virginia and Dublin) could limit Azure's growth regardless of demand.

    Opportunities and Catalysts

    • Monetization of Copilot: With over 90% of the Fortune 500 now using Copilot in some capacity, the "conversion" from free trials to paid enterprise-wide licenses is a major revenue catalyst.
    • Gaming Expansion: Following the Activision deal, Microsoft is perfectly positioned to turn gaming into a "Netflix-style" recurring revenue stream, potentially decoupling it from the 7-year console hardware cycle.
    • Cybersecurity: As AI-driven cyber threats increase, Microsoft’s Security division (generating over $25B in annual revenue) acts as a high-margin "insurance policy" for the digital age.

    Investor Sentiment and Analyst Coverage

    Sentiment remains overwhelmingly positive, with over 90% of Wall Street analysts maintaining a "Buy" or "Strong Buy" rating. The average price target as of late January 2026 is approximately $614. Institutional ownership remains extremely high (over 70%), reflecting the stock's status as a foundational "must-own" holding for pension funds and ETFs. However, some hedge funds have trimmed positions recently, citing the elevated P/E ratio (currently 32x-34x forward earnings) and the potential for a "CAPEX hangover."

    Regulatory, Policy, and Geopolitical Factors

    Microsoft faces a complex regulatory map:

    • EU Digital Markets Act (DMA): Ongoing compliance costs to ensure interoperability and fair competition in Europe.
    • AI Safety Regulations: Governments are increasingly demanding "explainability" and safety guardrails in AI models, which could slow the release of new features.
    • Geopolitics: The "Great Silicon Wall" between the U.S. and China continues to restrict certain AI hardware and software exports, though Microsoft’s primary markets remain the U.S., Europe, and India.

    Conclusion

    As Microsoft prepares to report its Q2 FY2026 earnings, the narrative is no longer about potential, but about execution. The company has successfully built the infrastructure for the AI era; the question now is whether the world is ready to utilize that infrastructure at a scale that justifies a $100 billion annual spend.

    For long-term investors, Microsoft remains the ultimate "all-weather" tech stock. It possesses the most complete AI stack in the industry, a legendary management team, and a cash-flow machine that allows it to invest at a scale few can match. However, the next 12 months will be a period of consolidation. Investors should watch Azure's constant-currency growth—anything below 37% could trigger a valuation reset—and monitor the compression of cloud margins as the infrastructure bill comes due. Microsoft is betting the farm on AI; today’s results will tell us if the crop is starting to grow.


    Disclaimer: This content is intended for informational purposes only and is not financial advice. The author has no position in any of the stocks mentioned at the time of writing.

  • The Firefly Ascendancy: A Deep Dive into Firefly Aerospace’s Public Era (FLY)

    The Firefly Ascendancy: A Deep Dive into Firefly Aerospace’s Public Era (FLY)

    As of January 28, 2026, the global aerospace sector stands at a critical juncture. The "New Space" gold rush, once defined by speculative ventures and SPAC-fueled dreams, has matured into a disciplined market where execution is the only currency. At the heart of this transformation is Firefly Aerospace Inc. (NASDAQ: FLY), a company that has transitioned from a scrappy underdog to a diversified powerhouse in space transportation.

    Firefly’s 2025 initial public offering was one of the most anticipated events in the sector, marking the arrival of a legitimate competitor to established giants. With a unique "End-to-End" space services model—comprising launch vehicles, lunar landers, and orbital transfer vehicles—Firefly is no longer just a rocket company. It is a logistics backbone for the emerging lunar economy and a strategic asset for national security. However, as the stock navigates a volatile post-IPO landscape, investors are weighing the company's technical triumphs against the inherent risks of the final frontier.

    Historical Background

    Firefly's journey to the public markets was anything but linear. Founded in 2014 as Firefly Space Systems, the company faced an early existential crisis, filing for bankruptcy in 2017. It was resurrected by Noosphere Ventures, which provided the capital and vision to pivot toward the "Alpha" rocket—a vehicle designed to offer the highest payload capacity in the small-satellite class.

    The company underwent a significant transformation in 2021 and 2022, shifting away from its initial ownership structure due to U.S. government concerns over foreign investment, eventually coming under the control of private equity firm AE Industrial Partners. This move cleared the path for high-stakes government contracts. Under the leadership of former CEO Bill Weber, Firefly accelerated its launch cadence and successfully landed the Blue Ghost lunar lander contract with NASA. The appointment of Jason Kim as CEO in late 2024 marked the start of Firefly’s "Public Era," focusing on manufacturing scale, defense integration, and the ambitious "Eclipse" medium-lift program.

    Business Model

    Firefly Aerospace operates a vertically integrated business model designed to capture value at every stage of a space mission. Its revenue streams are diversified across three core segments:

    1. Launch Services: This includes the Alpha rocket, catering to the 1,000 kg class small-satellite market, and the upcoming Eclipse (Medium Launch Vehicle), developed in partnership with Northrop Grumman (NYSE: NOC).
    2. Lunar Landers: Through the Blue Ghost program, Firefly provides delivery services to the lunar surface. This segment is heavily supported by NASA’s Commercial Lunar Payload Services (CLPS) program.
    3. Space Utility & Logistics: The Elytra line of orbital transfer vehicles (OTVs) provides "last mile" delivery in space, including satellite maneuvering, hosting, and de-orbiting services.

    This "Launch-Land-Link" strategy allows Firefly to cross-sell services to a single customer, such as a government agency that needs a satellite launched (Alpha), moved to a specific orbit (Elytra), or a payload delivered to the Moon (Blue Ghost).

    Stock Performance Overview

    Since its IPO on August 7, 2025, Firefly’s stock (FLY) has experienced the classic volatility associated with high-growth aerospace firms.

    • IPO Performance: Priced at $45.00, the stock initially surged to $52.00 on day one but faced significant selling pressure in late 2025 following a technical anomaly during Alpha’s Flight 6.
    • Recent Trends: After bottoming out near $24.00 in December 2025, the stock has begun what analysts call a "Golden Dome" recovery. As of late January 2026, FLY is trading between $27.00 and $29.00.
    • Market Cap: Firefly’s market capitalization currently sits at approximately $4.01 billion. While this is a significant discount from its IPO highs, it reflects a more grounded valuation as the market awaits the inaugural flight of the Eclipse rocket.

    Financial Performance

    Firefly’s Q3 2025 earnings report, released in November, provided a glimpse into the company’s scaling phase.

    • Revenue Growth: The company reported $30.8 million for the quarter, a staggering 98% increase over the previous quarter, driven by progress payments for Blue Ghost Mission 2 and Alpha launch contracts.
    • Profitability: Firefly remains in a net-loss position, reporting an EPS of -$0.33, though this beat analyst expectations of -$0.42.
    • Backlog: The most impressive metric is the company’s $1.3 billion backlog, which provides a multi-year revenue runway.
    • Balance Sheet: With nearly $800 million in cash remaining from its IPO proceeds, Firefly is well-capitalized to fund the development of the Eclipse rocket through its 2026 debut.

    Leadership and Management

    The leadership transition from Bill Weber to Jason Kim in October 2024 has been viewed favorably by the Department of Defense (DoD) and institutional investors. Kim, the former CEO of Millennium Space Systems, brought deep expertise in national security space programs.

    Under Kim, Firefly has adopted a "defense-first" posture, prioritizing "Tactically Responsive Space" (TRS) capabilities. This strategy was validated by the company's performance in missions like VICTUS HAZE, where Firefly demonstrated the ability to launch on short notice. The management team is currently focused on "productionizing" the Alpha rocket—moving from experimental launches to a repeatable, high-cadence manufacturing model.

    Products, Services, and Innovations

    Firefly’s technology stack is designed for reliability and performance at a lower cost point than legacy providers.

    • Alpha Rocket: Features an all-carbon-composite structure and the Reaver and Lightning engines. The Alpha Block II upgrade, introduced in early 2026, increases payload capacity and streamlines the manufacturing process using 3D-printed components.
    • Eclipse (MLV): This medium-lift vehicle is the "crown jewel" of Firefly’s pipeline. Powered by seven Miranda engines, it is designed to lift 16,000 kg to Low Earth Orbit. It serves as a direct domestic replacement for the Russian-engine-reliant Antares rocket.
    • Blue Ghost Lander: Firefly made history in March 2025 as the first commercial company to complete a fully successful, long-duration lunar landing (Mission 1), operating on the surface for over 300 hours.

    Competitive Landscape

    The space industry in 2026 is a three-tiered battlefield:

    • SpaceX: The undisputed leader. Firefly does not compete directly with the Falcon 9’s heavy-lift capacity but positions itself as a more flexible, dedicated alternative for missions that don't want to wait for a SpaceX rideshare.
    • Rocket Lab (NASDAQ: RKLB): Firefly’s primary rival. While Rocket Lab’s Electron has a higher launch cadence, Firefly’s Alpha offers nearly triple the payload capacity. The upcoming battle between Firefly’s Eclipse and Rocket Lab’s Neutron will determine who dominates the medium-lift market.
    • Legacy Primes: Boeing (NYSE: BA) and Lockheed Martin (NYSE: LMT) are increasingly partnering with Firefly rather than competing, as seen in the Northrop Grumman-Firefly alliance.

    Industry and Market Trends

    Three macro trends are currently favoring Firefly:

    1. Responsive Space: The DoD is shifting toward "tactically responsive" capabilities—the ability to replace lost satellites or launch new ones within hours or days of a conflict. Firefly’s liquid-fueled Alpha is uniquely suited for this "warm standby" requirement.
    2. The Lunar Economy: With the Artemis program in full swing, the Moon is no longer a destination for flags and footprints but a site for permanent infrastructure. Firefly’s Blue Ghost is a critical "truck" for this lunar logistics chain.
    3. Sovereign Launch: Countries are seeking independent access to space to avoid reliance on a single provider (SpaceX). Firefly’s modular technology is attractive for international partnerships.

    Risks and Challenges

    Investing in Firefly is not without significant peril:

    • Execution Risk: The Alpha rocket has a checkered flight history, including an anomaly in April 2025 and a ground test failure in September 2025. Any further "rapid unscheduled disassemblies" could erode customer confidence.
    • Developmental Hurdles: The Eclipse rocket is a massive technological leap. Delays in the Miranda engine testing or the 2026 inaugural flight would significantly impact the stock's valuation.
    • Capital Intensity: Despite the IPO cash, space is expensive. If the path to profitability stretches beyond 2027, Firefly may need further dilutive capital raises.

    Opportunities and Catalysts

    Several high-impact events are on the horizon for 2026:

    • Alpha Flight 7: Targeted for Q1 2026, a successful mission for Lockheed Martin would signal that the hydrocarbon contamination issues of 2025 are resolved.
    • Blue Ghost Mission 2: Scheduled for late 2026, this mission will land on the far side of the Moon. A success here would solidify Firefly’s lead in lunar logistics.
    • The "SpaceX Halo": With rumors of a SpaceX IPO later in 2026, the entire sector is expected to see a valuation re-rating. Firefly, as a liquid, pure-play space stock, stands to benefit from increased institutional interest in the sector.

    Investor Sentiment and Analyst Coverage

    Current analyst sentiment on FLY is "Cautiously Optimistic." Of the 12 major firms covering the stock, 7 have "Buy" ratings, 4 are "Hold," and 1 is "Sell."

    • Institutional Backing: Large positions from AE Industrial Partners provide stability, while hedge funds have begun "bottom-fishing" following the late-2025 dip.
    • Retail Chatter: On platforms like Reddit and X, Firefly is often compared to the "early days of SpaceX," with a vocal community focusing on the company’s successful Moon landing as proof of technical superiority over "paper rocket" competitors.

    Regulatory, Policy, and Geopolitical Factors

    Firefly operates in a highly regulated environment. The FAA’s Office of Commercial Space Transportation is a constant factor in launch timing. However, the current U.S. policy (specifically the "Space Force Gen 3" acquisition strategy) favors "non-traditional" providers like Firefly to ensure a resilient launch industrial base.

    Geopolitically, the race to the Moon’s South Pole against China creates a "must-succeed" environment for NASA’s CLPS providers. This provides Firefly with a degree of "political downside protection," as the U.S. government is incentivized to ensure Firefly remains a viable domestic launch and landing option.

    Conclusion

    Firefly Aerospace (FLY) represents a high-stakes bet on the second decade of the New Space era. The company has moved past the "can they build a rocket?" phase and into the "can they build a business?" phase.

    For investors, the narrative for 2026 is clear: Firefly is a "show-me" story. If the company can achieve a steady launch cadence with Alpha and stay on track for the Eclipse debut in Q4, the current $28 price point may look like a bargain in hindsight. However, in an industry where one small contamination error can result in a $100 million setback, the margin for error remains razor-thin. Firefly has the technology and the leadership to be a leader in the lunar economy; now, it just needs to stick the landing.


    This content is intended for informational purposes only and is not financial advice.

  • The Frictionless Engine: A Deep Dive into Synchrony Financial (SYF) in 2026

    The Frictionless Engine: A Deep Dive into Synchrony Financial (SYF) in 2026

    Date: January 28, 2026

    Introduction

    In the high-stakes world of consumer credit, few names command as much quiet authority as Synchrony Financial (NYSE: SYF). As the largest provider of private-label credit cards in the United States, Synchrony serves as the financial engine behind some of the world's most recognizable brands. Yet, as we enter early 2026, the company finds itself at a critical crossroads. After a blistering 2025 that saw the stock reach all-time highs, a recent earnings-induced correction and a fundamentally reshaped competitive landscape—headlined by the finalized Capital One-Discover merger—have forced investors to reassess the Synchrony narrative. This deep dive explores whether Synchrony’s specialized "ecosystem" model can withstand the rising tide of consolidated banking giants and shifting regulatory winds.

    Historical Background

    The story of Synchrony Financial is one of corporate liberation. For decades, the business operated as a cornerstone of GE Capital, the massive financial arm of General Electric. It was the "Retail Card" unit that powered the spending of millions of middle-class Americans at stores like JCPenney and Lowe’s.

    In 2014, as GE began its historic pivot back to industrial roots, Synchrony was spun off in one of the decade’s most significant IPOs. By late 2015, the separation was complete. Since gaining independence, Synchrony has transformed from a captive finance arm into a tech-forward financial services powerhouse. It has survived the loss of major partners (notably the 2019 exit of Walmart, which ironically returned in a new capacity in 2025) and navigated the volatile pandemic era by aggressively digitizing its platform and diversifying into high-margin sectors like health and wellness.

    Business Model

    Synchrony operates a specialized, "partner-centric" business model that differs significantly from traditional banks like JPMorgan Chase (NYSE: JPM). Its revenue is primarily derived from interest income and fees on credit products, segmented into three key pillars:

    1. Retail Card: This is the core engine, providing private-label and co-branded credit cards for giants like Amazon, Lowe’s, and TJX Companies.
    2. Payment Solutions: This segment offers promotional financing for "big-ticket" items, such as furniture, electronics, and jewelry. It is a key driver of purchase volume in high-inflation environments where consumers seek installment options.
    3. CareCredit: A crown jewel of the portfolio, CareCredit provides financing for health, veterinary, and personal care services not typically covered by insurance. It represents a "recession-resistant" moat that few competitors can replicate.

    Unlike general-purpose card issuers, Synchrony utilizes Retailer Share Arrangements (RSAs). This unique profit-sharing mechanism means that when the portfolio performs well, Synchrony shares a portion of the profits with its retail partners; conversely, when credit losses rise, the retailers shoulder some of the burden, providing Synchrony with a built-in hedge against economic downturns.

    Stock Performance Overview

    The journey for SYF shareholders over the last year has been nothing short of a roller coaster.

    • 1-Year Performance: In early 2025, SYF was trading in the mid-$40s. Driven by a resilient U.S. consumer and the unexpected vacation of the CFPB’s late fee cap in April 2025, the stock surged over 90%, hitting an all-time high of $88.77 on January 6, 2026.
    • Recent Volatility: Following its Q4 2025 earnings report on January 27, 2026, the stock gapped lower, currently trading in the $74.00 – $76.00 range. This 15% correction reflects investor anxiety over a revenue miss and a cautious 2026 outlook.
    • Long-Term Horizon: Over a 5-year and 10-year period, Synchrony has largely outperformed the broader financial sector (XLF), thanks to its aggressive capital return strategy, having retired nearly 40% of its outstanding shares since 2016.

    Financial Performance

    Synchrony’s latest financial report, released yesterday, presents a picture of a company with high profitability but slowing top-line momentum.

    • Earnings: Adjusted EPS for Q4 2025 came in at $2.18, beating analyst expectations. For the full year 2025, Synchrony delivered a record $9.28 per share.
    • Margins: The Net Interest Margin (NIM) was a standout at 15.83%, an 82-basis point increase year-over-year. This expansion was fueled by the "PPPCs" (Product, Pricing, and Policy Changes) Synchrony implemented in anticipation of regulatory changes that never fully materialized.
    • Credit Quality: Net charge-offs stabilized at 5.37% in Q4, down from the peaks seen in mid-2024. While delinquencies remain slightly above pre-pandemic norms, they have plateaued, suggesting the "credit normalization" cycle is nearing its end.
    • Valuation: At current prices, SYF trades at a forward P/E of roughly 7.9x, a significant discount to the broader market and even to peers like American Express (NYSE: AXP), reflecting the "private-label discount" the market often applies to SYF due to its higher exposure to sub-prime and near-prime borrowers.

    Leadership and Management

    CEO Brian Doubles, who took the helm in 2021, has been the architect of Synchrony’s "Digital First" transformation. Under his leadership, the company has successfully pivoted from being a "card company" to a "data company." Doubles is highly regarded by Wall Street for his transparency and disciplined capital allocation.

    The management team’s strategy is currently focused on three themes: Diversification (reducing reliance on any single retailer), Digitization (70% of applications are now mobile), and Defensiveness (maintaining a Tier 1 Common Equity ratio of 12.8%, well above regulatory requirements).

    Products, Services, and Innovations

    Innovation at Synchrony in 2026 is defined by the integration of "Buy Now, Pay Later" (BNPL) into traditional credit.

    • Synchrony SetPay: This product allows consumers to choose between monthly installments or a revolving line of credit at the point of sale, directly competing with fintechs like Affirm (NASDAQ: AFRM).
    • CareCredit Expansion: The platform has moved beyond dentistry and veterinary care into "Med-Surg" and high-end wellness, with over 270,000 provider locations.
    • AI Underwriting: Synchrony has deployed proprietary machine learning models that analyze non-traditional data—such as utility payment history—to approve "thin-file" customers who would otherwise be rejected by traditional FICO-based models.

    Competitive Landscape

    The competitive terrain shifted permanently on May 18, 2025, when Capital One (NYSE: COF) completed its acquisition of Discover Financial Services. This merger created a behemoth with a proprietary payment network, allowing Capital One to offer retailers lower interchange fees than Synchrony.

    Synchrony remains the market leader in the Private Label Credit Card (PLCC) space with roughly 38% market share, but it now faces a "Big Three" oligopoly consisting of itself, the new Capital One-Discover entity, and Citigroup (NYSE: C). Additionally, Bread Financial (NYSE: BFH) has emerged as a nimble, AI-centric competitor in the mid-market retail space.

    Industry and Market Trends

    Three trends are currently shaping the industry in early 2026:

    1. The Convergence of Credit: The line between a credit card and a BNPL loan has blurred. Consumers now expect "pay-in-four" options and revolving credit on a single digital interface.
    2. Asset-Backed Financing (ABF): With traditional corporate lending slowing, more capital is flowing into asset-backed structures. Synchrony has leveraged this by securitizing its credit card receivables to maintain liquidity.
    3. Consumer "K-Shaped" Resilience: While high-income spenders continue to drive purchase volume in the CareCredit and Luxury segments, lower-income consumers are showing signs of strain, leading to the plateau in loan growth (down 1% in Q4 2025).

    Risks and Challenges

    • Credit Sensitivity: Synchrony’s portfolio is more sensitive to unemployment spikes than diversified banks. If the U.S. enters a recession in late 2026, charge-offs could quickly exceed the 6.0% "comfort zone."
    • Legislative "Black Swans": The Credit Card Competition Act (CCCA) remains a threat. If passed, it could force Synchrony to offer multiple networks on its cards, potentially complicating its lucrative co-brand partnerships.
    • Concentration Risk: While more diversified than in the past, a loss of a major partner like Amazon or PayPal would be catastrophic for the stock price.

    Opportunities and Catalysts

    • The "OnePay" Walmart Growth: The 2025 launch of the Walmart OnePay program is just beginning to scale. As the world's largest retailer pushes its digital wallet, Synchrony stands to capture a massive influx of new, high-frequency data.
    • Lowe’s Pro Acquisition: The early 2026 acquisition of Lowe’s commercial "Pro" card program signals a move into the B2B space, which typically offers lower default rates and higher transaction volumes.
    • Share Buybacks: With a new $2.5 billion repurchase authorization, Synchrony is essentially betting on itself, signaling to the market that management believes the stock is undervalued at sub-8x earnings.

    Investor Sentiment and Analyst Coverage

    Sentiment is currently "Cautiously Bullish." Wall Street analysts generally maintain a "Buy" or "Hold" rating, with a consensus price target near $82.00. Institutional ownership remains high, with giants like Vanguard and BlackRock holding significant stakes. However, retail "chatter" on platforms like WallStreetBets has cooled following the recent 15% drop, as momentum traders exit in favor of more stable "magnificent seven" tech names.

    Regulatory, Policy, and Geopolitical Factors

    The regulatory environment in 2026 is surprisingly favorable compared to 2024. The April 2025 court ruling that vacated the CFPB's $8 late fee cap was a "get out of jail free" card for Synchrony. However, the Federal Reserve’s interest rate path remains the primary macro driver. As the Fed began cutting rates in late 2025, Synchrony’s funding costs dropped, but so did the yields on its floating-rate loans. The "sweet spot" for SYF is a "higher-for-longer" environment with low unemployment—a Goldilocks scenario that is currently under test.

    Conclusion

    Synchrony Financial enters the heart of 2026 as a leaner, more digital, and more diversified version of its former self. While the recent stock correction has been painful for those who bought at the $88 peak, the fundamental engine remains robust. The company has successfully defended its margins against regulatory overreach and integrated BNPL technology to stay relevant to Gen Z and Millennial spenders.

    The primary watch-item for investors is whether the Capital One-Discover merger begins to "poach" Synchrony's anchor retail partners. For now, Synchrony’s deep integration into retailer workflows and its unique CareCredit moat provide a formidable defense. At a P/E of 7.9x and a generous buyback program, SYF represents a classic "value with a catalyst" play, provided the U.S. consumer remains employed and the credit normalization trend holds its current plateau.


    This content is intended for informational purposes only and is not financial advice.

  • The Great Pivot: Kimberly-Clark’s High-Stakes Transformation in 2026

    The Great Pivot: Kimberly-Clark’s High-Stakes Transformation in 2026

    As of January 28, 2026, Kimberly-Clark Corporation (NYSE: KMB) stands at the most consequential crossroads in its 154-year history. Traditionally viewed as the "steady Eddie" of the consumer staples sector—a defensive powerhouse known for its Dividend King status and iconic brands like Huggies and Kleenex—the company is currently in the midst of a radical structural metamorphosis. Under the leadership of CEO Mike Hsu, Kimberly-Clark is shedding its legacy as a broad-based paper products company to become a high-margin, agile, pure-play personal care giant.

    This transition comes at a time of significant market volatility. While the broader S&P 500 has navigated the shifting tides of the mid-2020s, KMB has been an outlier of activity, recently reporting a surprise earnings beat for the fourth quarter of 2025 that has sent ripples through the analyst community. With a massive $40 billion-plus acquisition of Kenvue (the former consumer health division of Johnson & Johnson) looming and a strategic joint venture with Brazilian pulp titan Suzano finalized, Kimberly-Clark is no longer just a "diaper and tissue" stock—it is a transformation story that investors are watching with bated breath.

    Historical Background

    The origins of Kimberly-Clark trace back to 1872 in Neenah, Wisconsin. Founded by John A. Kimberly, Charles B. Clark, Joseph Babcock, and Franklyn C. Shattuck, the company began as a small regional paper mill. However, its trajectory changed forever during World War I. The company’s scientists developed Cellucotton, a creped cellulose wadding that was five times more absorbent than cotton and significantly cheaper. Used as surgical bandages on the front lines, Cellucotton laid the foundation for the company’s consumer-facing future.

    In 1920, utilizing surplus material from the war, Kimberly-Clark launched Kotex, the first disposable feminine hygiene product. Four years later, it introduced Kleenex facial tissue. Originally marketed as a way to remove cold cream, the brand became a cultural phenomenon when consumers began using it as a disposable handkerchief. By 1929, the company was public on the New York Stock Exchange.

    The latter half of the 20th century was defined by the introduction of Huggies in 1978, which revolutionized the diaper market with its patented "hourglass" shape, and the 1995 acquisition of Scott Paper Company for $9.4 billion. This move cemented Kimberly-Clark as a leader in both consumer tissue and personal care, a dual-engine model that lasted until the current "Powering Care" era.

    Business Model

    Kimberly-Clark’s business model is currently undergoing a structural "de-risking" and simplification. Historically, the company operated through three segments:

    1. Personal Care: Includes Huggies, Pull-Ups, Kotex, and Depend.
    2. Consumer Tissue: Includes Kleenex, Scott, and Cottonelle.
    3. K-C Professional: Focusing on workplace solutions (wipers, soaps, and dispensers).

    In 2026, the company is pivoting toward a "Pure-Play Personal Care" model. By forming a $3.4 billion joint venture with Suzano (the world’s largest hardwood pulp producer), Kimberly-Clark has deconsolidated a large portion of its International Family Care business. This strategic move allows the company to offload the volatile commodity risks associated with pulp production while retaining a 49% stake in the profits.

    Revenue is now increasingly concentrated in high-margin, non-discretionary personal care products in North America and emerging markets like China and Latin America. The pending acquisition of Kenvue is expected to further tilt the model toward health-related consumer products, effectively making Kimberly-Clark a hybrid of a consumer staples firm and a healthcare auxiliary.

    Stock Performance Overview

    The last 12 to 24 months have been a roller-coaster for KMB shareholders:

    • 1-Year Performance: Throughout 2025, the stock was a victim of its own transition. After hitting an all-time high of $142.87 in March 2025, the share price underwent a sharp correction, falling nearly 23% to end the year near $100.89. This was largely due to investor anxiety regarding the complexity of the Suzano JV and the potential debt burden of the Kenvue acquisition.
    • 5-Year and 10-Year Performance: On a long-term basis, KMB has lagged behind the broader market (S&P 500) but has outperformed many peers in the consumer staples index during periods of high inflation. Its 5-year CAGR remains modest, reflecting its "defensive" nature rather than high-growth characteristics.
    • Recent Movement: Following the Q4 2025 earnings release on January 27, 2026, the stock has shown signs of life, recovering to the $101–$102 range as of today. The market appears to be rewarding the company's shift from "price-led" growth to "volume-led" growth.

    Financial Performance

    Kimberly-Clark’s fiscal year 2025 results, released yesterday, indicate that the "Powering Care" strategy is beginning to bear fruit:

    • Revenue: Full-year net sales reached $16.4 billion, a slight reported decline of 2.1% due to divestitures of the PPE business. However, organic sales grew 1.7%, fueled by a 2.5% increase in volume and mix.
    • Profitability: Adjusted EPS for 2025 came in at $7.53, up 3.2% year-over-year. Most impressively, the Q4 adjusted EPS of $1.86 beat the Wall Street consensus of $1.81.
    • Margins: Adjusted gross margins improved to 37.0% in late 2025, driven by a massive 7.2% productivity saving (via the FORCE program).
    • Dividend: Kimberly-Clark remains a Dividend King, having raised its dividend for 53 consecutive years. The current yield hovers around 4.8%, making it a top pick for income-seeking investors.

    Leadership and Management

    Mike Hsu, Chairman and CEO, is the architect of the current transformation. Since taking the helm, Hsu has been vocal about moving away from the "cost-cutting only" mindset of his predecessors. His strategy focuses on:

    • Agility: Breaking the company into three streamlined business segments.
    • Innovation: Using digital tools and AI to optimize manufacturing and consumer insights.
    • Portfolio Re-shaping: The bold Kenvue and Suzano deals define his legacy.

    Hsu’s management team is generally well-regarded for their transparency, though some analysts have criticized the timing of the Kenvue deal, citing high interest rates as a headwind for the necessary debt financing.

    Products, Services, and Innovations

    Innovation in 2026 is centered on "Skin Health" and "Sustainability."

    • Huggies & Goodnites: The company has successfully launched "Skin Health" tiers, partnering with high-profile figures like NBA star Giannis Antetokounmpo to market premium diapers that prevent irritation.
    • Digital Transformation: KMB is now utilizing advanced data analytics to predict when parents will need their next diaper subscription, boosting e-commerce loyalty.
    • Sustainable Fibers: At its Loudon, Tennessee facility, the company has pioneered recycled fiber technologies that have allowed the Scott brand to maintain its value position while meeting new environmental standards.

    Competitive Landscape

    Kimberly-Clark remains locked in a perpetual battle with Procter & Gamble (NYSE: PG).

    • Volume Battle: In 2025, KMB managed to grow volumes by 2.5%, whereas P&G struggled with flat-to-negative volumes as consumers resisted price hikes.
    • Market Share: While Pampers (P&G) still leads the North American diaper market with ~44% share, Huggies (KMB) has clawed back territory, reaching approximately 37% share as of early 2026.
    • Private Label: The decision to exit private-label diaper manufacturing has allowed KMB to focus solely on its premium brands, though it leaves the "value" end of the market open to smaller, nimble competitors.

    Industry and Market Trends

    The consumer staples sector in 2026 is defined by:

    1. Volume Recovery: After years of price-driven growth (due to post-COVID inflation), consumers are now looking for "value" through larger pack sizes and tiered pricing.
    2. Health-Staple Convergence: The line between a cleaning product and a health product is blurring, which is the primary driver behind the Kenvue merger.
    3. Digital-First Retail: E-commerce now accounts for over 20% of Kimberly-Clark’s sales in key markets.

    Risks and Challenges

    • Debt and Integration: The Kenvue acquisition is a "bet the farm" move. Integrating a $40 billion business while carrying significant debt in a mid-interest-rate environment is a major execution risk.
    • PFAS Litigation: KMB faces ongoing legal challenges regarding "forever chemicals." A significant class-action lawsuit in Connecticut regarding legacy manufacturing could result in billion-dollar settlements.
    • Demographics: Declining birth rates in developed markets and China continue to put long-term pressure on the diaper (Personal Care) segment.

    Opportunities and Catalysts

    • The Kenvue Synergy: If successfully integrated, Kenvue provides KMB with world-class R&D in skin health and a massive footprint in the OTC (over-the-counter) medicine market.
    • Emerging Market Personal Care: As middle-class populations grow in Latin America and Southeast Asia, the adoption of premium diapers and feminine care products offers a decades-long growth runway.
    • Suzano JV Closing: The final regulatory approval of the Suzano JV in mid-2026 will serve as a major catalyst, potentially freeing up cash flow for debt reduction or share buybacks.

    Investor Sentiment and Analyst Coverage

    The consensus on Wall Street is currently a "Hold."

    • The Bulls: Argue that KMB is undervalued at its current $101 price point, with a median price target of $136.78 (representing ~34% upside). They see the Suzano JV as a masterstroke in margin protection.
    • The Bears: Are concerned about the "structural fragility" of the pulp supply chain and the complexity of the Kenvue integration.
    • Institutional Activity: Major hedge funds have slightly increased their positions in early 2026, viewing the Q4 volume growth as a sign that the company has finally found its footing in the "new normal" economy.

    Regulatory, Policy, and Geopolitical Factors

    • EU Packaging and Packaging Waste Directive (PPWD): Effective August 2026, this law will require KMB to fund the recycling costs of its packaging across the EU, putting pressure on European margins.
    • EUDR (Deforestation Regulation): Starting in early 2026, KMB must prove all pulp imported into the EU is "deforestation-free." This adds an administrative burden to their Brazilian supply chain.
    • Geopolitics: Trade friction between the U.S. and Brazil could potentially impact the cost of pulp, though the Suzano JV is designed to mitigate these fluctuations through localized profit sharing.

    Conclusion

    Kimberly-Clark is no longer the predictable, slow-moving company it was a decade ago. It is a business in the middle of a high-stakes pivot. The recent Q4 2025 earnings beat proves that the core brands—Huggies, Kleenex, and Scott—remain incredibly resilient and are capable of driving volume growth even in a saturated market.

    However, the road ahead is fraught with "integration risk." The acquisition of Kenvue and the divestiture of international tissue assets are massive shifts that will take years to fully digest. For the income-focused investor, KMB’s 4.8% yield and 53-year dividend growth streak remain a beacon of safety. For the growth-oriented investor, the "new" Kimberly-Clark offers a unique opportunity to own a pure-play personal care leader at a transitional valuation. Investors should keep a close eye on the mid-2026 closure of the Suzano deal and the progress of the Kenvue integration as the primary barometers for the stock’s future performance.


    This content is intended for informational purposes only and is not financial advice.

  • The Quiet Compounder’s Reckoning: A Deep Dive into Roper Technologies (ROP)

    The Quiet Compounder’s Reckoning: A Deep Dive into Roper Technologies (ROP)

    In the high-stakes world of the S&P 500, few companies have mastered the art of the "quiet compounder" as effectively as Roper Technologies, Inc. (NYSE: ROP). Long known as the textbook example of a successful industrial-to-tech pivot, Roper has built a multi-billion dollar empire by operating in the shadows of niche software markets. However, as of January 28, 2026, the company is finding itself under an uncharacteristically bright—and harsh—spotlight. Following its fourth-quarter and full-year 2025 earnings report released yesterday, the stock has experienced its most significant single-day sell-off in recent years. This deep dive examines whether the current price contraction represents a rare entry point into one of the market's most disciplined capital allocators or if the "Roper Model" is finally facing its reckoning in an era of higher interest rates and AI-driven disruption.

    Historical Background

    The Roper story is one of radical transformation. Founded in 1919 by George D. Roper as a manufacturer of kitchen appliances and industrial pumps, the company spent much of the 20th century as a traditional industrial conglomerate. The modern era of Roper began in 2001 under the late Brian Jellison, who took the helm and initiated a pivot that would become business school canon.

    Jellison recognized that capital-intensive businesses were vulnerable to cyclicality and low margins. He began divesting heavy manufacturing units and reinvesting the proceeds into "asset-light," high-margin technology companies. Over the next two decades, Roper morphed from a pump manufacturer into a diversified software and technology-enabled product powerhouse. Today, while it retains "Technologies" in its name, it functions more like a disciplined private equity firm with a permanent capital base, focusing on "Tier 1" businesses with high recurring revenue and dominant positions in niche markets.

    Business Model

    Roper’s business model—frequently referred to as the "Roper Model"—is predicated on three pillars: decentralization, asset-light operations, and disciplined capital allocation. Unlike many tech giants that seek to build a unified ecosystem, Roper allows its roughly 45 subsidiary companies to operate independently. The corporate headquarters in Sarasota, Florida, remains intentionally lean, focusing solely on where to deploy the massive cash flow generated by its units.

    The company categorizes its operations into three main segments:

    1. Application Software: The largest and fastest-growing segment, providing mission-critical software for industries like healthcare, legal, and construction.
    2. Network Software: Focuses on cloud-based marketplaces and data networks for industries like freight (DAT) and insurance (iPipeline).
    3. Technology Enabled Products: The legacy-adjacent segment that produces high-tech hardware like Neptune water meters and Verathon medical devices.

    Crucially, over 75% of Roper's revenue is now derived from software, much of it via high-retention SaaS (Software as a Service) models.

    Stock Performance Overview

    Historically, ROP has been a "darling" of long-term institutional investors. Over the last decade, it has consistently outperformed the broader S&P 500, driven by its compounding free cash flow. However, the last 12 months have been a roller coaster.

    Prior to late January 2026, the stock was trading near its 52-week high of $595.17. However, the earnings release on January 27, 2026, triggered a massive sell-off. As of today, January 28, 2026, the stock is trading around $364.56—a staggering decline that has erased nearly two years of gains in a matter of days. This brings the 1-year performance into deep negative territory, even as the 5-year and 10-year charts still show significant capital appreciation for long-term holders who entered at lower cost bases.

    Financial Performance

    Roper’s FY 2025 results, reported on January 27, 2026, revealed a complex picture. Total revenue for the year reached $7.90 billion, a 12% increase compared to 2024. This growth was supported by a 5% organic increase and a 7% contribution from new acquisitions.

    The "bottom line" told a story of margin pressure. Adjusted Diluted Earnings Per Share (DEPS) came in at $20.00, a 9% year-over-year increase, but GAAP net earnings actually fell 1% to $1.54 billion. The primary culprit for the stock's recent crash was a $20 million revenue miss in the fourth quarter, primarily attributed to slowing license revenue in its Deltek unit (government contracting) and continued weakness in the freight markets impacting its DAT subsidiary.

    Despite the revenue miss, Roper’s cash generation remains its strongest suit. Adjusted free cash flow for 2025 was $2.47 billion, representing a robust 31% FCF margin. This cash flow is what fuels the company’s aggressive acquisition pipeline.

    Leadership and Management

    L. Neil Hunn has served as President and CEO since 2018, having succeeded Brian Jellison. Hunn has been the architect of Roper’s final transition into a pure-play software and tech entity. Under his leadership, the company has divested its last major industrial process units to focus on vertical software.

    In late 2025, Hunn made a strategic move to "upscale" the leadership team for the AI era. The company hired Shane Luke as SVP of AI and Edward Raffaele as VP of AI Engineering. This was a notable departure from Roper's purely decentralized history, as this centralized "AI Strike Team" is tasked with helping individual business units integrate generative AI into their products—a signal that Roper recognizes the existential threat and opportunity AI poses to its niche software moats.

    Products, Services, and Innovations

    Roper’s portfolio includes several "category kings." For instance, Deltek is the gold standard for project-based accounting software used by government contractors. Vertafore provides the backbone for the independent insurance agency market. Neptune leads in smart water metering, an essential component of modern utility infrastructure.

    Innovation at Roper typically happens at the subsidiary level. However, 2025 saw a flurry of AI-related updates. Aderant, its legal software unit, launched a generative AI assistant for automated billing and compliance, while Verathon integrated advanced imaging AI into its medical diagnostic tools. The "innovation pipeline" at Roper is less about moonshots and more about incremental, high-value feature additions that increase customer "stickiness" and justify annual price increases.

    Competitive Landscape

    Roper operates in a unique competitive space. Its closest peer in terms of business model is Constellation Software (TSX: CSU), though Roper tends to focus on larger "Tier 1" acquisitions compared to Constellation’s high-volume, small-deal approach.

    In its specific verticals, Roper faces different rivals:

    • Application Software: Competes with specialized firms like Tyler Technologies (NYSE: TYL) in the public sector.
    • Network Software: Faces competition from logistics tech firms and fintech players.
    • Technology Enabled Products: Competes with diversified industrials like Danaher (NYSE: DHR) in life sciences and medical tech.

    Roper’s primary competitive advantage is its "moat" in niche markets where the cost of switching software is prohibitively high for customers, leading to retention rates often exceeding 95%.

    Industry and Market Trends

    Three major trends are currently shaping Roper’s environment:

    1. The SaaS Migration: Roper has spent the last three years aggressively moving its legacy on-premise customers to SaaS models. This transition is largely complete but creates short-term "revenue headwinds" as high upfront license fees are replaced by recurring subscriptions.
    2. Vertical AI: Unlike horizontal AI (like ChatGPT), vertical AI focuses on specific professional workflows. Roper is betting that its deep data sets in legal, insurance, and healthcare will make its AI tools more valuable than generic alternatives.
    3. Digital Infrastructure: Increased government spending on "smart cities" and utility modernization continues to drive demand for Neptune’s smart metering technology.

    Risks and Challenges

    The recent stock plunge highlights several critical risks:

    • Cost of Capital: The "Roper Model" relies on cheap debt to fund acquisitions. With interest rates remaining higher for longer than many anticipated in 2024, the interest expense on Roper’s revolving credit facility increased by $66 million in 2025, eating into margins.
    • Valuation Multiples: Roper often pays 20x+ EBITDA for high-quality software firms. If organic growth slows, as it did in Q4 2025, investors become less willing to pay a premium for the stock.
    • Macro Sensitivity: While its software is "mission-critical," units like DAT (freight) are sensitive to the broader economy. The prolonged freight recession of 2024-2025 has been a persistent drag on the Network Software segment.

    Opportunities and Catalysts

    Despite the recent gloom, several catalysts could spark a recovery:

    • Share Repurchases: In a tactical shift, the Board authorized a $3 billion share repurchase program in late 2025. With the stock currently trading at a 12-month low, management is likely to be aggressive in buying back shares, which would support EPS in 2026.
    • M&A Dry Powder: Roper ended 2025 with significant liquidity. If the market downturn lowers the valuation of private software companies, Roper could find "bargain" acquisitions to fuel future growth.
    • CentralReach Integration: The $1.65 billion acquisition of CentralReach (ABA therapy software) is expected to be a major organic growth driver in 2026, with projected growth rates exceeding 20%.

    Investor Sentiment and Analyst Coverage

    Wall Street sentiment has shifted from "Strong Buy" to "Wait and See" in the last 48 hours. Following the Jan 27 earnings miss, Stifel downgraded the stock to "Hold" with a price target of $385, while Mizuho issued an "Underperform" rating. However, Oppenheimer remains bullish, maintaining an "Outperform" rating, arguing that the FCF generation is too strong to ignore at these price levels. Institutional ownership remains high, with firms like Vanguard and BlackRock holding significant stakes, typically favoring Roper for its low volatility—until now.

    Regulatory, Policy, and Geopolitical Factors

    Roper’s exposure to government contracting through Deltek makes it sensitive to U.S. federal budget cycles and procurement laws. Any significant shifts in the National Defense Authorization Act (NDAA) or changes in federal software compliance standards (like FedRAMP) can impact its pipeline. Additionally, as a global player, Roper must navigate tightening data privacy regulations (GDPR in Europe and various state-level laws in the U.S.), which increases the compliance costs for its software subsidiaries.

    Conclusion

    Roper Technologies is at a crossroads. For twenty years, it has been a master of the "buy and build" strategy, transforming itself into a tech titan. The current 10-15% drop in stock price reflects a market that is suddenly skeptical of the company's ability to maintain high growth rates amidst higher interest costs and a sluggish freight market.

    However, the core of the Roper thesis remains intact: the company generates immense amounts of cash, holds dominant positions in "boring but essential" software niches, and is led by a management team that has proven its ability to pivot. For the disciplined investor, the current volatility may be the first chance in years to acquire shares of this compounder at a discount—provided they believe Neil Hunn can successfully navigate the transition to an AI-driven, higher-rate environment.


    This content is intended for informational purposes only and is not financial advice.

  • PACCAR Inc (PCAR): A Century of Profitability Meets the Autonomous Frontier

    PACCAR Inc (PCAR): A Century of Profitability Meets the Autonomous Frontier

    As of January 28, 2026, PACCAR Inc (NASDAQ: PCAR) stands at a pivotal crossroads between industrial tradition and a high-tech future. For over a century, the Bellevue-based manufacturer has been the "gold standard" of the heavy-duty truck market, known primarily for its premium Kenworth, Peterbilt, and DAF brands. However, the conversation surrounding PACCAR in early 2026 has shifted from simple diesel dominance to its leadership in autonomous freight and zero-emission powertrains.

    Following its latest Q4 2025 earnings release, the company continues to defy cyclical gravity, marking 87 consecutive years of net profitability. With the heavy-duty trucking industry facing a massive regulatory shift in 2027, PACCAR is currently the focus of intense investor scrutiny. This article provides a deep-dive analysis into the company’s storied history, its financial resilience, and its aggressive pivot toward a driverless, decarbonized future.

    Historical Background

    PACCAR’s journey began in 1905 when William Pigott, Sr. founded the Seattle Car Mfg. Co. to produce railway and logging equipment. The company’s early years were defined by its ability to adapt to the rugged demands of the Pacific Northwest’s timber industry. By 1917, it merged with Twohy Brothers of Portland to become the Pacific Car and Foundry Company, a name it would hold for decades.

    The company’s true transformation into a trucking titan began in the mid-20th century. In 1945, it acquired the Kenworth Motor Truck Company, followed by the Peterbilt Motors Company in 1958. These acquisitions allowed PACCAR to dominate the premium "owner-operator" and high-end fleet markets in North America. In 1972, the company officially rebranded as PACCAR Inc, reflecting its diversified industrial footprint.

    The late 1990s marked its global expansion, with the acquisition of DAF Trucks in the Netherlands (1996) and Leyland Trucks in the UK (1998). These moves gave PACCAR a formidable presence in the European and export markets, establishing the "triad" of Kenworth, Peterbilt, and DAF that defines the company today.

    Business Model

    PACCAR operates a highly integrated business model designed to capture value across the entire lifecycle of a commercial vehicle. It operates through three primary segments:

    1. Truck Segment: This is the core of the business, designing and manufacturing light-, medium-, and heavy-duty trucks. PACCAR’s "local-for-local" manufacturing strategy allows it to customize trucks for regional markets, maintaining a premium price point.
    2. PACCAR Parts: Often described as the company’s "crown jewel," this segment provides aftermarket parts distribution. It is a high-margin, counter-cyclical business. When new truck sales slow down, fleets maintain older trucks longer, driving parts revenue. In 2025, this segment reached a record $6.87 billion in revenue.
    3. PACCAR Financial Services (PFS): With a portfolio of over 226,000 trucks and trailers, PFS facilitates truck sales by providing specialized financing and leasing. This segment also manages the resale of used trucks, providing PACCAR with critical data on vehicle residual values.

    Stock Performance Overview

    PACCAR has long been a favorite for industrial-focused investors due to its consistent total returns. As of late January 2026, the stock’s performance reflects its "steady-eddy" reputation with a technological kicker:

    • 1-Year Performance: The stock has climbed approximately 13.9% over the last 12 months, outperforming many of its industrial peers as investors priced in the upcoming "pre-buy" cycle (where fleets buy trucks ahead of 2027 emissions changes).
    • 5-Year Performance: On a split-adjusted basis, PCAR has surged between 140% and 180%, a testament to its record-breaking profits in 2023 and 2024.
    • 10-Year Performance: Including reinvested dividends, PACCAR’s total return has exceeded 450%, vastly outperforming the S&P 500 Industrial Sector.

    Currently trading around $120.81, the stock remains near its 52-week high of $124.53, though it experienced a brief 5% pullback following its Q4 2025 earnings report due to a slight EPS miss.

    Financial Performance

    In its full-year 2025 financial results reported on January 27, 2026, PACCAR demonstrated its ability to remain profitable even as global freight demand normalized from pandemic-era highs.

    • 2025 Revenue: $28.44 billion (compared to $33.66 billion in 2024).
    • Net Income: $2.38 billion, which included a non-recurring $264.5 million charge related to long-standing European civil litigation.
    • Earnings Per Share (EPS): $4.51 for the full year.
    • Dividends: PACCAR remains a dividend powerhouse. In 2025, it paid a total of $2.72 per share, including a significant $1.40 special dividend declared in December 2025 and paid in early January 2026.

    The company maintains an A+/A1 credit rating and ended 2025 with strong manufacturing cash flow, allowing it to fund massive R&D projects for autonomous and electric trucks without taking on excessive debt.

    Leadership and Management

    PACCAR is characterized by its long-tenured, "promote-from-within" leadership culture.

    • R. Preston Feight (CEO): A 25-year veteran of the company, Feight took the helm in 2019. He has been the architect of PACCAR’s "tech-forward" strategy, emphasizing high-margin parts growth and the partnership with Aurora Innovation.
    • Mark C. Pigott (Executive Chairman): Representing the founding family, Pigott provides a link to the company’s historical conservative financial management, ensuring the company maintains its 80+ year streak of profitability.
    • Brice J. Poplawski (CFO): Poplawski has been instrumental in managing PACCAR’s robust balance sheet and navigating the inflationary pressures of 2024-2025.

    The management team is widely respected on Wall Street for its disciplined capital allocation and its refusal to engage in the "growth at any cost" mentality that has plagued some EV truck startups.

    Products, Services, and Innovations

    PACCAR’s current lineup is a blend of traditional power and futuristic tech:

    • Flagship Models: The Peterbilt 579 and Kenworth T680 remain the industry benchmarks for aerodynamics and fuel efficiency.
    • Zero-Emission Pipeline: Through its Amplify Cell Technologies joint venture with Cummins and Daimler, PACCAR is securing its own supply of LFP (Lithium Iron Phosphate) battery cells for its 579EV and T680E models.
    • Hydrogen Fuel Cells: PACCAR has partnered with Toyota to integrate fuel cell stacks into its heavy-duty trucks, targeting long-haul routes where battery weight is a deterrent.
    • Autonomous Driving: The most significant innovation is the partnership with Aurora Innovation. In early 2026, the company confirmed that Aurora’s "Virtual Driver" is now fully integrated into PACCAR’s redundant chassis, with a commercial "driverless" launch scheduled for Q2 2026.

    Competitive Landscape

    PACCAR competes in a "Big Four" market in North America and Europe:

    • Daimler Truck (DTG.DE): The owner of Freightliner is PACCAR’s most direct competitor. While Freightliner has higher market share in the US (roughly 35-40%), PACCAR maintains higher margins due to its premium branding.
    • Volvo Group (VLVLY): A leader in European electrification, Volvo competes fiercely with PACCAR’s DAF brand in Europe and Peterbilt/Kenworth in the US.
    • Traton Group (8TRA.DE): The parent of Navistar (International), Scania, and MAN. Since Volkswagen's Traton acquired Navistar, they have become a more formidable technological rival in the US.

    PACCAR’s competitive edge lies in its residual value. Kenworth and Peterbilt trucks historically hold their value better than Freightliners or Internationals, making them more attractive to fleets looking at the "total cost of ownership."

    Industry and Market Trends

    Two massive trends are currently dominating the truck market in 2026:

    1. The "Pre-Buy" Cycle: With the EPA 2027 emissions standards looming, fleets are expected to front-load their purchases in late 2025 and 2026. These "pre-buy" trucks will be the last of the current, cheaper emissions technology, likely creating a revenue surge for PACCAR over the next 18 months.
    2. Digitalization of the Fleet: Trucks are becoming "rolling data centers." PACCAR’s focus on connected vehicles allows them to monitor engine health in real-time, driving customers back to PACCAR Parts for predictive maintenance—a trend that is decoupling PACCAR’s profit from the cyclical nature of new truck sales.

    Risks and Challenges

    Despite its strengths, PACCAR faces several headwinds:

    • Regulatory Costs: The EPA 2027 standards are expected to add $10,000 to $15,000 to the cost of a new truck. There is a risk that this will lead to a "post-buy" slump in 2027.
    • Legal & Litigation: In 2025, PACCAR was forced to take a significant charge related to long-running price-fixing litigation in Europe. While many of these claims are now settled, residual legal risks remain.
    • Electrification Infrastructure: While PACCAR has the trucks, the lack of a national charging and hydrogen refueling network limits the scale of ZEV adoption, potentially stranding some of PACCAR’s R&D investments.

    Opportunities and Catalysts

    • Autonomous Freight Launch: If the Aurora-powered trucks successfully begin driverless operations in Q2 2026, PACCAR will be the first legacy OEM to offer a truly autonomous-ready platform at scale.
    • Infrastructure Bill Spending: Continued US infrastructure spending is driving demand for vocational trucks (dump trucks, mixers), a segment where Peterbilt and Kenworth hold a dominant market share.
    • Special Dividends: PACCAR’s habit of issuing massive year-end special dividends ($1.40 in 2025) remains a strong catalyst for income-focused investors.

    Investor Sentiment and Analyst Coverage

    Wall Street maintains a "Hold" to "Moderate Buy" consensus on PCAR.

    • Institutional Support: The stock is heavily owned by "smart money," with Vanguard (12%) and BlackRock (~7%) as top holders. This provides a level of price stability.
    • Analyst Views: JPMorgan recently issued an "Overweight" rating with a $142 price target, citing the 2026 pre-buy as a major driver. Conversely, Morgan Stanley remains "Equal-Weight," concerned that 2025 earnings normalization might lead to a period of sideways trading.
    • Retail Sentiment: On platforms like Stocktwits, sentiment is generally positive but cautious, with users focused on the Q4 earnings miss and the sustainability of the special dividend.

    Regulatory, Policy, and Geopolitical Factors

    PACCAR’s global footprint makes it sensitive to trade policy.

    • EPA 2027: The most critical regulation, requiring a 90% reduction in NOx emissions. PACCAR has been preparing for this for years, and its MX-13 engines are already undergoing certification.
    • Geopolitics: PACCAR’s "local-for-local" manufacturing—building trucks in the regions where they are sold—insulates it somewhat from global trade wars. However, tariffs on steel or aluminum could still impact production costs in their Mexican and US plants.

    Conclusion

    PACCAR Inc remains one of the most resilient and well-managed companies in the global industrial sector. As it moves through 2026, the company is expertly navigating the transition from a traditional manufacturer to a technology leader. While the 2025 earnings normalization and the European litigation charge were minor speed bumps, the long-term thesis remains intact.

    Investors should watch the Q2 2026 autonomous launch with Aurora as a primary technological milestone, and the order intake for late 2026 as a gauge for the strength of the EPA pre-buy. PACCAR’s 87-year streak of profitability is not just a historical curiosity; it is a reflection of a business model that prioritizes margins, quality, and technological adaptation over fleeting market trends.


    This content is intended for informational purposes only and is not financial advice. Today's date is January 28, 2026.

  • The Silent Architect of the AI Era: A Deep-Dive into Seagate Technology (STX)

    The Silent Architect of the AI Era: A Deep-Dive into Seagate Technology (STX)

    Date: January 28, 2026

    Introduction

    As the global economy grapples with the sheer scale of the artificial intelligence (AI) revolution, one company has emerged as the unsung architect of the digital infrastructure required to sustain it: Seagate Technology Holdings (NASDAQ: STX). For years, the hard disk drive (HDD) industry was dismissed by many Silicon Valley pundits as a "legacy" sector, destined to be cannibalized by faster solid-state drives (SSDs). However, as of early 2026, that narrative has been decisively overturned.

    Seagate is currently in the spotlight following a spectacular 2025 performance, fueled by an "AI storage supercycle." With the explosion of Large Language Models (LLMs) and generative AI, the world’s appetite for mass data storage has reached a fever pitch. Seagate’s role as a dominant provider of high-capacity "nearline" storage has transformed the stock into a high-growth darling, trading near all-time highs as it successfully commercializes its breakthrough Heat-Assisted Magnetic Recording (HAMR) technology.

    Historical Background

    Founded in 1978 by Al Shugart and Finis Conner, Seagate was the first company to develop a 5.25-inch hard disk drive, effectively miniaturizing storage and enabling the personal computer revolution. Over the following decades, the company weathered intense industry consolidation, shifting its focus from desktop PCs to enterprise servers and eventually to the massive cloud data centers that define the modern internet.

    The most critical turning point in Seagate's recent history was its decision to double down on HDD technology while competitors diversified more aggressively into NAND flash. By betting that the cost-per-terabyte advantage of magnetic recording would remain unbeatable for mass-capacity storage, Seagate positioned itself to dominate the "exascale" era. The 2024–2025 period marked the culmination of this strategy, as the company finally solved the engineering hurdles of HAMR, a technology decades in the making.

    Business Model

    Seagate operates a highly concentrated business model focused on "Mass Capacity" storage. Its revenue is primarily derived from the sale of high-capacity hard drives to Cloud Service Providers (CSPs) like Amazon (NASDAQ: AMZN), Google (NASDAQ: GOOGL), and Microsoft (NASDAQ: MSFT), as well as large enterprise Original Equipment Manufacturers (OEMs).

    The company has transitioned toward a "Build-to-Order" operational model, which emphasizes long-term volume commitments from customers rather than speculative manufacturing. This shift has mitigated the boom-and-bust cycles typical of the semiconductor industry, allowing Seagate to maintain tighter inventory levels and higher pricing power. While the company maintains a presence in the SSD market and provides data management services through its "Lyve Cloud" platform, these segments remain secondary to its core HDD business, which accounts for over 90% of its total revenue.

    Stock Performance Overview

    As of January 28, 2026, Seagate’s stock performance has been nothing short of extraordinary. Over the 1-year horizon, the stock has returned approximately 225%, skyrocketing from the $110 level in early 2025 to a current range of $350–$360.

    The 5-year return stands at a staggering 566%, outperforming many of its peers in the S&P 500. Investors who held the stock for 10 years have seen a total return (including reinvested dividends) of nearly 2,000%. The primary driver of this recent vertical move has been the market's realization that AI "data lakes"—the massive repositories of information used to train AI models—require the exact type of high-density, low-cost storage that only Seagate provides at scale.

    Financial Performance

    Seagate’s most recent financial results, reported on January 27, 2026, for the second quarter of fiscal 2026, solidified its status as a top-tier tech performer.

    • Revenue: The company reported $2.83 billion in quarterly revenue, surpassing analyst expectations of $2.73 billion.
    • Profitability: Non-GAAP gross margin reached a historic 42.2%, a significant jump from the 23-25% range seen just two years ago.
    • Earnings: Diluted EPS for the quarter was $3.11, well above the $2.77 consensus.
    • Debt & Cash: The company successfully retired $500 million in debt in late 2025 and maintains a healthy cash flow, supported by its disciplined capital allocation strategy.

    Seagate’s fiscal 2025 was equally impressive, with total revenue of $9.1 billion, representing a 39% year-over-year increase. The company's valuation, while high relative to historical norms, is supported by a significant expansion in operating margins (now exceeding 30%).

    Leadership and Management

    CEO Dave Mosley has been the architect of Seagate’s recent resurgence. Since taking the helm in 2017, Mosley has focused on operational efficiency and the difficult engineering transition to HAMR. In October 2025, Mosley was also elected as Board Chair, consolidating his control over the company’s long-term strategy.

    The management team is widely respected for its "value over volume" approach. By refusing to engage in price wars for low-capacity, low-margin drives, Mosley has successfully repositioned Seagate as a high-margin technology leader. Governance remains a strong point for the company, with a long history of returning capital to shareholders through a consistent dividend (currently yielding roughly 0.8% following the massive share price appreciation).

    Products, Services, and Innovations

    The crown jewel of Seagate’s current lineup is the Mozaic 3+ platform. This technology utilizes HAMR to increase the areal density of platters, allowing Seagate to ship drives with capacities of 30TB and beyond. In the last quarter alone, Seagate shipped over 1.5 million HAMR-based units, proving that the technology is ready for prime time.

    The company is already in the qualification phase for Mozaic 4+, which will enable drives with capacities exceeding 44TB. In addition to hardware, Seagate’s Corvault self-healing storage systems are gaining traction in enterprise data centers. These systems use "Autonomous Drive Regeneration" (ADR) to repair drives in situ, significantly reducing maintenance costs for cloud providers.

    Competitive Landscape

    Seagate operates in a functional duopoly with Western Digital (NASDAQ: WDC). Following Western Digital’s split of its Flash and HDD businesses in late 2025, the two companies are now competing on a more direct basis.

    Seagate currently holds a technological lead in the ultra-high-capacity segment. While Western Digital has utilized "UltraSMR" technology to reach 32TB capacities using traditional recording methods, Seagate's Mozaic 3+ (HAMR) platform offers higher density and lower power consumption per terabyte. This has given Seagate a 12-to-18-month "first-mover" advantage in the 30TB+ category. Toshiba (TYO: 6502) remains the third player in the market but has struggled to match the R&D spending required to compete in the highest-capacity tiers.

    Industry and Market Trends

    The "AI Data Cycle" is the defining trend for Seagate. While AI compute (GPUs) grabbed the early headlines, the focus has shifted to AI storage. Training a modern LLM requires petabytes of data, and the resulting AI-generated content creates a feedback loop of even more data that must be stored.

    Furthermore, a massive "refresh cycle" is underway. Thousands of data centers globally are replacing aging 12TB and 16TB drives with new 30TB+ HAMR drives. This allows operators to double their storage capacity within the same physical footprint and power envelope—a critical consideration as power availability becomes a bottleneck for AI expansion.

    Risks and Challenges

    Despite the bullish narrative, Seagate faces several significant risks:

    1. Geopolitical Exposure: Seagate’s largest and most efficient manufacturing facility is located in Wuxi, China. Any escalation in US-China trade tensions could disrupt its entire supply chain.
    2. SSD Price Parity: While HDDs remain much cheaper per terabyte than SSDs for mass storage, any sudden breakthrough in QLC (Quad-Level Cell) flash pricing could narrow that gap, particularly in the lower-capacity (10TB–20TB) enterprise segments.
    3. Cyclicality: The storage industry is historically cyclical. While current demand is high, a "digestion period" by cloud providers could lead to a sharp pullback in orders.
    4. Raw Material Supply: The manufacturing of HAMR drives requires specialized materials, including platinum and glass, which are subject to inflationary pressures and supply chain bottlenecks.

    Opportunities and Catalysts

    Several catalysts could drive STX shares even higher:

    • The 50TB Milestone: Seagate is expected to unveil a 50TB drive prototype by late 2026, which would further cement its lead over Western Digital.
    • Sovereign AI: Governments worldwide are building national AI clouds. These projects prioritize data sovereignty and long-term storage, opening up a multi-billion dollar market outside the traditional big-tech cloud providers.
    • Share Buybacks: With debt levels normalized and cash flow at record levels, many analysts expect Seagate to announce a massive share repurchase program in mid-2026.

    Investor Sentiment and Analyst Coverage

    Wall Street is overwhelmingly positive on Seagate, though some analysts have moved to a "Neutral" rating simply due to the stock’s rapid price appreciation. As of January 2026:

    • Rosenblatt Securities maintains a "Buy" rating with a street-high price target of $500.
    • Evercore ISI has a target of $450, citing the high visibility of earnings through 2027.
    • Retail Sentiment: On social platforms, Seagate is frequently discussed as a "picks and shovels" play for the AI era, often compared to Nvidia (NASDAQ: NVDA) in terms of its critical role in the tech stack.

    Regulatory, Policy, and Geopolitical Factors

    Regulatory scrutiny on data privacy (GDPR in Europe and similar laws in the US) has indirectly benefited Seagate by forcing companies to keep more data for longer periods for compliance and audit purposes.

    However, the US-China "Tech War" remains a wildcard. While a temporary "truce" on export controls was reached in late 2025, the potential for new restrictions on the export of high-capacity storage technology to Chinese AI firms is a persistent threat. Seagate must navigate these waters carefully to maintain its access to the massive Chinese hyperscaler market.

    Conclusion

    Seagate Technology Holdings has successfully navigated the transition from a commodity hardware manufacturer to a high-margin infrastructure powerhouse. By betting on HAMR technology when others hesitated, Seagate has secured a dominant position in the most critical layer of the AI economy: the storage of the world’s data.

    For investors, the case for Seagate rests on its record-breaking margins and the structural shift toward mass-capacity storage. While the stock’s recent rally has been steep and geopolitical risks loom, the company’s fundamental earnings power appears to be at a permanent step-change higher. As the world generates more data in the next two years than in the previous ten, Seagate’s "Mozaic" of innovation may continue to yield impressive returns for the foreseeable future.


    This content is intended for informational purposes only and is not financial advice.

  • The Omaha Giant at a Crossroads: A 2026 Deep-Dive into Union Pacific Corporation (UNP)

    The Omaha Giant at a Crossroads: A 2026 Deep-Dive into Union Pacific Corporation (UNP)

    Today’s Date: January 28, 2026

    Introduction

    As we enter the first quarter of 2026, Union Pacific Corporation (NYSE: UNP) finds itself at the center of the most significant upheaval in the North American railroad industry since the late 1990s. While most large-cap industrial companies are navigating a shifting macroeconomic landscape of "higher for longer" interest rates and a cooling manufacturing sector, Union Pacific is engaged in a high-stakes chess match with federal regulators over its proposed $85 billion merger with Norfolk Southern (NYSE: NSC).

    In its latest earnings report released just yesterday, January 27, 2026, Union Pacific demonstrated why it remains the gold standard of freight efficiency. Despite a slight miss on fourth-quarter earnings-per-share estimates, the company reported record full-year net income of $7.1 billion. This article provides a comprehensive deep-dive into the "Omaha Giant," examining whether its pursuit of the first true transcontinental railroad will propel it to new heights or lead to a protracted regulatory quagmire.

    Historical Background

    Union Pacific is more than just a railroad; it is a foundational pillar of the American economy. Its history began with the Pacific Railroad Act of 1862, signed into law by President Abraham Lincoln during the height of the Civil War. The goal was to connect the Atlantic and Pacific coasts, a feat achieved in 1869 when Union Pacific met the Central Pacific Railroad at Promontory Summit, Utah.

    Throughout the 20th century, the company underwent a series of massive transformations that consolidated the Western rail landscape. Key milestones include:

    • 1982: The merger with Missouri Pacific and Western Pacific, which significantly expanded its footprint in the South and West.
    • 1995-1996: The acquisitions of Chicago and North Western and Southern Pacific. These moves created the Western duopoly that exists today between Union Pacific and BNSF Railway.

    Over the last decade, the company has pivoted from a volume-focused strategy to an efficiency-first model known as Precision Scheduled Railroading (PSR), which has radically reshaped its profitability and service metrics.

    Business Model

    Union Pacific operates approximately 32,000 route miles across 23 states in the western two-thirds of the United States. Its revenue model is diversified across three primary freight segments:

    1. Industrial: This is the company’s largest revenue driver, encompassing chemicals, plastics, forest products, and minerals. UNP leverages its proximity to the Gulf Coast petrochemical complex to maintain high-margin long-haul contracts.
    2. Bulk: This segment includes grain, fertilizers, and energy products (coal and renewables). While coal has faced a long-term decline, UNP’s bulk segment has remained resilient due to a 2025 surge in grain exports to Mexico and specialized renewable diesel shipments.
    3. Premium: Comprising Intermodal (containers) and Automotive traffic. This segment is highly sensitive to consumer spending and competition from the trucking industry. Union Pacific owns or operates the most efficient gateways into Mexico, making it a critical link for the North American automotive supply chain.

    Stock Performance Overview

    Over the past decade, Union Pacific has been a cornerstone of "Dividend Aristocrat" portfolios, though recent years have seen increased volatility.

    • 10-Year Performance: UNP has significantly outperformed the S&P 500 on a total return basis over the last decade, driven by aggressive share buybacks and a compounding dividend.
    • 5-Year Performance: The stock saw substantial gains during the post-pandemic supply chain crunch but leveled off in 2024-2025 as the industry grappled with labor negotiations and cooling freight demand.
    • 1-Year Performance: The last 12 months have been defined by "merger mania." The stock spiked in mid-2025 on the Norfolk Southern merger announcement but has recently faced a 5% pullback following the Surface Transportation Board’s (STB) rejection of the initial merger application on January 16, 2026.

    Financial Performance

    For the full year 2025, Union Pacific reported:

    • Net Income: $7.1 billion (a 6% increase year-over-year).
    • Earnings Per Share (EPS): $11.98.
    • Operating Ratio (OR): 59.3%. This is a critical metric for railroads; a lower number indicates higher efficiency. UNP’s sub-60% OR remains the envy of the industry.

    However, the Q4 2025 results revealed some cracks. The company reported an adjusted EPS of $2.86, missing the consensus analyst estimate of $2.88. This was largely attributed to a "negative business mix"—a rise in lower-margin intermodal volume coupled with a decline in higher-margin automotive shipments due to high interest rates impacting car sales.

    Leadership and Management

    The resurgence of Union Pacific’s operational efficiency is widely credited to CEO Jim Vena, who took the helm in August 2023. Vena, a disciple of the legendary railroader Hunter Harrison, has moved the company toward a "Safety, Service, and Operational Excellence" (SSOE) strategy.

    Unlike predecessors who cut assets to the absolute minimum, Vena has introduced the "Buffer Strategy." He maintains a surplus of locomotives and crews to ensure that the railroad can handle sudden volume spikes or extreme weather without the service meltdowns that plagued the industry in 2022. This leadership approach has significantly improved employee morale and restored trust with large industrial shippers.

    Products, Services, and Innovations

    Union Pacific is moving beyond traditional rail services through several technological and structural innovations:

    • The Laredo Gateway: UNP remains the only railroad to serve all six major Mexico gateways, with Laredo serving as the crown jewel. Its "Falcon Premium" service, partnered with Canadian National (NYSE: CNI), provides the fastest rail service between Mexico and Chicago.
    • Net-Zero Initiatives: UNP is currently testing high-horsepower hydrogen-locomotive prototypes and has invested heavily in "Precision Dispatch" software to optimize fuel consumption.
    • Autonomous Yard Operations: The company is slowly rolling out autonomous technology in its sorting yards to reduce human error and improve safety in high-risk environments.

    Competitive Landscape

    The primary rival remains BNSF Railway, owned by Berkshire Hathaway (NYSE: BRK.A). While BNSF has a larger share of the northern grain corridors, Union Pacific maintains a superior Operating Ratio and higher profitability per carload.

    The newest threat is CPKC (NYSE: CP), the result of the Canadian Pacific and Kansas City Southern merger. CPKC offers the only single-line rail service connecting Canada, the U.S., and Mexico. Union Pacific’s proposed merger with Norfolk Southern is viewed by many as a direct competitive response to CPKC, seeking to create a similarly seamless East-West network.

    Industry and Market Trends

    The "Reshoring" and "Nearshoring" trends are the most significant macro drivers for UNP. As manufacturing moves from China to Mexico and the American South, Union Pacific’s network is perfectly positioned to capture the resulting freight flows. However, the industry is currently battling a "Freight Recession" in the trucking sector, where low truck rates have lured some intermodal shippers away from the rails.

    Risks and Challenges

    • Regulatory Obstacles: The Surface Transportation Board (STB) is increasingly skeptical of consolidation. The January 16 rejection of the Norfolk Southern merger application cited "incomplete market impact analyses."
    • Safety and Public Perception: Following the East Palestine derailment (by Norfolk Southern), the entire industry is under microscopic safety scrutiny. Any major derailment for UNP could lead to punitive new regulations.
    • Labor Relations: While a strike was averted in late 2022, labor unions remain vocal about sick leave and crew consist (the number of people on a train).

    Opportunities and Catalysts

    • The "Great Connection": If UNP successfully refiles and wins approval for the Norfolk Southern merger by late 2026, it would create a monopolistic advantage for transcontinental shipping, allowing it to bypass the costly "Chicago handoff."
    • Energy Transition: While coal is fading, the transport of lithium for batteries, wind turbine components, and biofuels represents a multi-billion dollar growth vertical.
    • Capital Allocation: UNP remains committed to returning nearly 100% of its free cash flow to shareholders via dividends and buybacks.

    Investor Sentiment and Analyst Coverage

    Wall Street is currently divided on UNP. Institutional heavyweights like Vanguard and BlackRock remain "overweight," viewing the stock as a defensive play with a massive "moat." However, some analysts have recently downgraded the stock to "Hold" until there is more clarity on the Norfolk Southern merger. The consensus price target sits around $265, suggesting modest upside from current levels unless the regulatory environment shifts favorably.

    Regulatory, Policy, and Geopolitical Factors

    The outcome of the 2024 U.S. Presidential election continues to resonate in early 2026, with trade policies toward Mexico being the primary variable for UNP. Any tariffs on Mexican-made autos would directly impact UNP’s Premium segment. Additionally, the STB’s "Reciprocal Switching" rules—which could force railroads to share tracks with competitors—remain a looming threat to profit margins.

    Conclusion

    Union Pacific Corporation stands at a crossroads. Financially, the company is a powerhouse, boasting best-in-class margins and a disciplined management team under Jim Vena. Operationally, it is more resilient than it has been in decades. However, its future valuation is now inextricably tied to its ability to convince regulators that a transcontinental merger is in the public interest.

    For investors, UNP remains a quintessential "bedrock" stock. It offers a combination of a 2.5% dividend yield and exposure to the long-term industrialization of the North American continent. The next six months—leading up to the June 22 deadline for the revised merger filing—will be the most critical period for the stock in a generation. Investors should watch Operating Ratio trends and STB commentary closely, as these will be the primary drivers of volatility in 2026.


    This content is intended for informational purposes only and is not financial advice.