Tag: Investing

  • Sweet Recovery: Why Hershey (HSY) Surged 9% and What it Means for 2026

    Sweet Recovery: Why Hershey (HSY) Surged 9% and What it Means for 2026

    On February 6, 2026, the global consumer staples market is buzzing with a singular name: The Hershey Company (NYSE: HSY). Following its fiscal results reported yesterday, the legendary chocolatier saw its stock price surge by over 9%, marking its most significant single-day gain in years. For a company often viewed as a "slow and steady" dividend play, such a jump suggests a profound shift in market sentiment.

    Hershey has spent the last two years navigating a "perfect storm" of record-high cocoa prices, shifting consumer health trends, and a leadership transition. However, the February 2026 earnings report signaled that the clouds are finally parting. With a massive earnings beat and an optimistic outlook for 2026, Hershey is proving that its pivot into a "Snacking Powerhouse" is not just a marketing slogan, but a robust financial reality.

    Historical Background

    The Hershey Company’s story is synonymous with the American Dream. Founded by Milton S. Hershey in 1894, the company began as the Hershey Chocolate Company, a subsidiary of his Lancaster Caramel Company. Milton’s vision was to make milk chocolate—then a luxury item—affordable for the masses. In 1903, he began construction of the world's largest chocolate manufacturing plant in Derry Township, Pennsylvania, which eventually became the town of Hershey.

    Throughout the 20th century, Hershey became a cultural icon. From the launch of the Hershey’s Kiss in 1907 to providing "Ration D" bars for soldiers in World War II, the company solidified its place in the American pantry. Over the decades, it evolved through strategic acquisitions, most notably the 1963 acquisition of the H.B. Reese Candy Company. In recent years, under the leadership of Michele Buck, the company underwent a "Great Transformation," diversifying beyond the candy aisle into salty snacks and "better-for-you" categories to ensure relevance in a health-conscious 21st century.
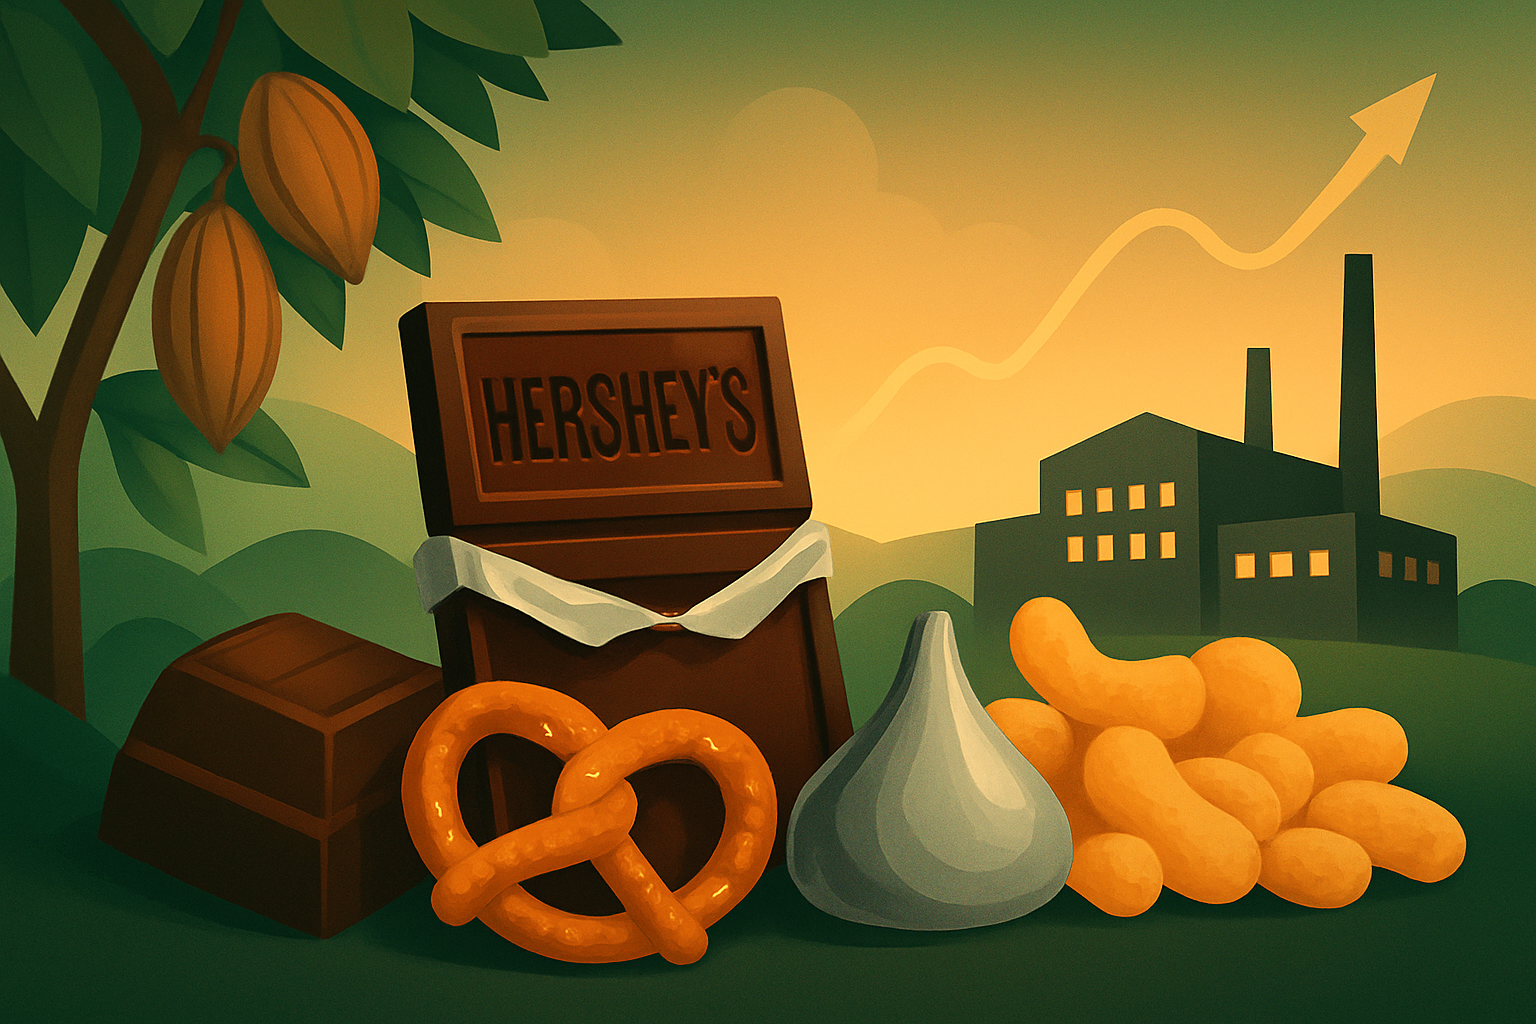
    Business Model

    Hershey’s business model is built on the pillars of brand equity, massive distribution scale, and manufacturing excellence. The company operates through three primary segments:

    1. North America Confectionery: This remains the crown jewel, accounting for the lion's share of revenue. It includes iconic brands like Hershey’s, Reese’s (the #1 candy brand in the U.S.), Kit Kat (under license), and Jolly Rancher.
    2. North America Salty Snacks: This is Hershey's high-growth engine. Through the acquisitions of Dot’s Homestyle Pretzels, SkinnyPop, and most recently LesserEvil (2025), Hershey has captured a significant portion of the "permissible indulgence" market.
    3. International: While smaller than its domestic business, this segment focuses on high-potential markets like Mexico, Brazil, and India, where the company is scaling its core brands to meet a rising global middle class.

    The company leverages a "hub-and-spoke" distribution model and is currently in the late stages of a massive digital transformation aimed at automating supply chains and optimizing retail shelf space through AI-driven analytics.

    Stock Performance Overview

    Over the last decade, HSY has been a hallmark of stability, though recent years have been volatile.

    • 10-Year Horizon: Investors have enjoyed a total return that generally outperformed the broader consumer staples sector, bolstered by consistent dividend growth.
    • 5-Year Horizon: The stock reached all-time highs in 2023 before a significant "cocoa correction" in 2024 and 2025 dragged the price down as commodity costs pressured margins.
    • 1-Year Horizon: Leading up to early 2026, the stock traded sideways as investors waited for evidence of margin recovery. The 9% jump on February 5, 2026, effectively erased a year of underperformance, pushing the stock back toward the $230 level.

    Financial Performance

    The Q4 2025 results were the primary catalyst for the recent stock surge. Hershey reported an Adjusted EPS of $1.71, crushing Wall Street’s expectations of $1.40.

    • Revenue Growth: Net sales rose 7.0% year-over-year to $3.09 billion, driven by price increases and a surprising resilience in volume.
    • Margins: Adjusted gross margins, which had dipped to the high 30s during the cocoa crisis, are projected to rebound to 41% in 2026.
    • Dividends: Demonstrating high confidence, the board announced a 6% increase in the quarterly dividend to $1.452 per share.
    • Debt: Total debt stands at approximately $5 billion, a manageable level (Debt-to-Equity ~1.24) that allows the company to continue its M&A strategy without over-leveraging.

    Leadership and Management

    Hershey is currently navigating a pivotal leadership transition. Michele Buck, the architect of the snacking powerhouse strategy and CEO since 2017, stepped down in August 2025. She remains a Senior Advisor through mid-2026.

    Taking the reins is Kirk Tanner, an industry veteran who previously held senior roles at PepsiCo and Wendy’s. Tanner’s appointment was seen as a strategic move to double down on the salty snacks and "impulse buy" channels. His focus on "operational excellence" and scaling the food-service side of the business has already begun to bear fruit, as evidenced by the efficient cost-cutting measures highlighted in the latest earnings call.

    Products, Services, and Innovations

    Innovation at Hershey is no longer just about new candy bar flavors. The company’s R&D pipeline is focused on three areas:

    1. Salty-Sweet Cross-overs: Products like Reese’s dipped pretzels and popcorn.
    2. Better-for-You (BFY): Expanding the Lily’s sweets brand (sugar-free) and LesserEvil popcorn to cater to health-conscious consumers and those on GLP-1 weight-loss medications.
    3. Packaging Innovation: Utilizing "seasonal" packaging and AI-driven shelf-ready designs to maximize visibility during holidays like Halloween and Easter, which account for a massive portion of annual sales.

    Competitive Landscape

    Hershey operates in a "land of giants." Its primary competitors include:

    • Mars, Inc.: A private behemoth that remains the global leader in chocolate. Mars has the advantage of a massive pet care business to offset food commodity swings.
    • Mondelez International (MDLZ): A fierce rival in the snacking space. Mondelez has a larger international footprint and a dominant position in biscuits (Oreo).
    • Ferrero Group: The Italian giant has been aggressively acquiring U.S. brands, challenging Hershey in the premium and "kid-focused" confectionery segments.

    Despite this, Hershey maintains a near 45% share of the U.S. chocolate market, a "moat" that is difficult for any competitor to breach.

    Industry and Market Trends

    The confectionery industry is currently defined by commodity deflation. After cocoa prices nearly tripled in 2024 due to supply shortages in West Africa, prices dropped 27% by early 2026. This "deflationary tailwind" is the single biggest factor driving Hershey’s 2026 guidance.

    Additionally, the rise of GLP-1 weight-loss drugs has forced the industry to adapt. Hershey has responded by pivoting toward "permissible indulgence"—smaller portion sizes and snack options that provide high flavor impact with lower caloric density.

    Risks and Challenges

    While the recent surge is positive, Hershey is not without risks:

    • Commodity Volatility: While cocoa prices have dropped, they remain higher than historical averages. Any further supply disruption in West Africa (Ivory Coast/Ghana) could squeeze margins again.
    • Health Trends: A long-term shift away from sugar remains a structural headwind for the core confectionery business.
    • Tariffs and Trade Policy: As an importer of sugar and cocoa, Hershey is sensitive to changes in U.S. trade policy and international tariffs.

    Opportunities and Catalysts

    The primary catalyst for the stock is the 2026 Guidance. Management projected adjusted EPS growth of 30–35% for the coming year.

    • M&A Potential: With a solid balance sheet, Hershey is widely expected to acquire more "Salty Snack" brands in 2026 to further diversify away from chocolate.
    • Digital Savings: The ongoing digital transformation is expected to unlock $300 million in annual savings by the end of 2026, which can be reinvested into brand building.

    Investor Sentiment and Analyst Coverage

    Wall Street has turned decidedly more bullish following the February report.

    • UBS raised its price target to $236, citing the "clearing of the clouds" regarding cocoa costs.
    • Goldman Sachs maintained a Buy rating, highlighting Kirk Tanner’s "refreshing focus on execution."
    • Institutional Sentiment: Large funds have begun rotating back into Hershey as a defensive play that now offers high-growth momentum.

    Regulatory, Policy, and Geopolitical Factors

    Geopolitical stability in West Africa is crucial for Hershey, as the region produces over 70% of the world's cocoa. Hershey has invested heavily in the "Cocoa For Good" program to address child labor and deforestation, partly to stay ahead of stricter European and U.S. supply chain regulations. Domestically, the company faces ongoing scrutiny regarding sugar content and labeling, requiring constant legal and compliance vigilance.

    Conclusion

    The 9% surge in Hershey’s stock on February 5, 2026, marks the end of a painful era of commodity-driven uncertainty and the beginning of a new chapter under CEO Kirk Tanner. By successfully integrating salty snacks and navigating a historic cocoa crisis, Hershey has proven the resilience of its brand and the agility of its business model.

    For investors, Hershey now represents a rare combination: a "Dividend King" with a 6% payout hike, and a "Momentum Play" with 30%+ projected earnings growth. While risks like sugar regulation and commodity swings remain, the "sweet spot" for Hershey appears to be back in 2026.


    This content is intended for informational purposes only and is not financial advice.

  • The Magic Kingdom at a Crossroads: An Investor’s Deep Dive into Disney (NYSE: DIS)

    The Magic Kingdom at a Crossroads: An Investor’s Deep Dive into Disney (NYSE: DIS)

    As of February 5, 2026, The Walt Disney Company (NYSE: DIS) finds itself at a historic inflection point. Long regarded as the gold standard of global entertainment, the company has spent the last several years aggressively restructuring its business model to survive the digital revolution. Today, the "House of Mouse" is no longer just a movie studio or a theme park operator; it is a diversified technology and media conglomerate navigating the most significant leadership transition in a generation. With the recent appointment of Josh D’Amaro as successor to Bob Iger and the flagship ESPN streaming service now in full swing, Disney is attempting to prove that its "flywheel" effect—where content drives park attendance, which drives merchandise, which drives streaming—is still the most potent engine in the S&P 500.

    Historical Background

    Founded in 1923 by Walt and Roy Disney, the company began as a small animation studio in Los Angeles. Over a century, it transformed through several distinct eras: the Golden Age of Animation, the mid-century expansion into live-action and theme parks (Disneyland opened in 1955), and the "Disney Renaissance" of the 1990s.

    The modern Disney was largely built during Bob Iger’s first tenure (2005–2020), marked by high-profile acquisitions including Pixar (2006), Marvel (2009), Lucasfilm (2012), and 21st Century Fox (2019). These moves consolidated much of the world’s most valuable intellectual property under one roof. However, the 2020s brought unprecedented challenges: a global pandemic that shuttered parks, a messy leadership transition to Bob Chapek, and a costly pivot to streaming that saw billions in losses before turning profitable in late 2024.

    Business Model

    Disney’s business model is organized into three core pillars, designed to feed into one another:

    1. Entertainment: This includes the Disney Entertainment division, overseeing film and TV production (Walt Disney Studios, 20th Century Studios, Searchlight) and the direct-to-consumer (DTC) streaming platforms, Disney+ and Hulu.
    2. Experiences: Often the company’s "cash cow," this segment encompasses six global resort destinations (Florida, California, Paris, Hong Kong, Shanghai, and Tokyo), the rapidly expanding Disney Cruise Line, and consumer products/licensing.
    3. Sports: Anchored by ESPN, this segment manages the "Project Flagship" direct-to-consumer app, linear sports networks, and the ESPN BET integration.

    The "flywheel" strategy remains the core: a hit film like Frozen or The Avengers generates ticket sales, then fuels theme park attractions, merchandise sales, and long-tail streaming revenue.

    Stock Performance Overview

    Disney’s stock performance over the last decade tells a story of a "fallen angel" attempting to regain its wings.

    • 1-Year Performance: The stock has seen a decline of approximately 8% over the past twelve months. Despite streaming profitability, investors have been cautious about the high costs associated with theme park expansions and the decay of linear television.
    • 5-Year Performance: Down roughly 35%, reflecting the massive valuation reset that hit all media companies as the "streaming wars" shifted from subscriber growth at all costs to a focus on bottom-line profitability.
    • 10-Year Performance: A modest total return of ~20%, significantly underperforming the broader S&P 500. For long-term holders, the last decade has been a test of patience as Disney digested its massive Fox acquisition and navigated the COVID-19 era.

    Financial Performance

    In its Q1 2026 earnings report, Disney showed signs of a stabilizing giant.

    • Revenue: Analysts project full-year 2026 revenue to exceed $101 billion for the first time in company history.
    • Earnings: Consensus EPS for FY2026 is pegged at $6.65, representing strong double-digit growth year-over-year.
    • Margins: Operating margins for the total company hover around 14.2%. Crucially, the streaming segment has moved from a cash burn to a profit contributor, with margins now in the 9-12% range.
    • Debt & Cash Flow: Disney has successfully deleveraged, reducing debt to approximately $46.6 billion. The company’s commitment to shareholder returns remains strong, with a planned $7 billion in share repurchases for 2026 and an annualized dividend of $1.50 per share.

    Leadership and Management

    The biggest news of 2026 is the conclusion of the succession saga. On February 2, the Board of Directors named Josh D’Amaro as the next CEO, effective March 18, 2026. D’Amaro, who previously led the Experiences division, is seen as a "culture-first" leader with a deep understanding of the guest experience.

    To balance D’Amaro’s operational focus, Dana Walden was promoted to President and Chief Creative Officer. Bob Iger will remain as a Senior Advisor and Board member through the end of 2026 to ensure a smooth transition. This "team-of-two" approach at the top is designed to satisfy both Wall Street (D’Amaro’s operational rigors) and Hollywood (Walden’s creative relationships).

    Products, Services, and Innovations

    Innovation in 2026 is focused on bridging the physical and digital worlds.

    • Disney+ & Hulu Integration: The full merger of these apps has streamlined the user experience, utilizing AI-driven personalization to increase engagement and reduce churn.
    • Epic Games Partnership: Disney’s $1.5 billion stake in Epic Games has begun to bear fruit, with a persistent "Disney Universe" inside Fortnite allowing fans to play, shop, and watch content in a seamless social environment.
    • Parks Innovation: Site preparation is underway for "Villains Land" at the Magic Kingdom, a massive multi-year project designed to refresh the domestic park's appeal.

    Competitive Landscape

    Disney faces a two-front war:

    • The Content Front: Netflix (NFLX) continues to dominate in global subscriber scale and original content volume. While Disney is now profitable in streaming, it still lags Netflix in terms of operating margin and international penetration.
    • The Physical Front: Comcast Corporation’s (NASDAQ: CMCSA) Universal Destinations & Experiences recently opened "Epic Universe" in Orlando. This new park is the most significant threat to Disney World’s dominance in decades, forcing Disney to accelerate its $60 billion capital expenditure plan to maintain its market share in Central Florida.

    Industry and Market Trends

    The media industry is currently defined by the "Great Compression." As linear TV viewership continues to slide, Disney must manage the managed decline of networks like ABC and Disney Channel while scaling ESPN’s digital presence. Meanwhile, the "experience economy" remains robust; consumers are prioritizing travel and "bucket list" experiences over physical goods, a trend that continues to favor Disney’s parks and cruise lines.

    Risks and Challenges

    • Linear Decay: The decline of the high-margin cable bundle remains a persistent headwind for the Entertainment and Sports segments.
    • Content Saturation: There is growing evidence of "superhero fatigue," requiring Disney to diversify its film slate beyond the Marvel and Star Wars franchises.
    • Capital Intensity: The $60 billion, 10-year park investment plan is massive. If a global recession hits, this high fixed-cost base could squeeze margins.
    • Succession Risk: While D’Amaro is well-liked, transitioning away from the Iger era is a high-stakes move that could lead to strategic volatility.

    Opportunities and Catalysts

    • ESPN Flagship: The 2025 launch of the standalone ESPN app is the "holy grail" for Disney’s sports strategy. Early 2026 data suggests strong adoption among younger demographics who never owned a cable box.
    • Cruise Expansion: With three new ships (Treasure, Destiny, and Adventure) entering service, the Disney Cruise Line is becoming a significant, high-margin revenue contributor.
    • AI Integration: Disney is utilizing AI to lower production costs in animation and to optimize park operations (crowd management, surge pricing), which could lead to meaningful margin expansion.

    Investor Sentiment and Analyst Coverage

    Wall Street maintains a "Moderate Buy" consensus on Disney. Analysts are largely optimistic about the D'Amaro appointment, viewing it as a commitment to the company's highest-return assets (the Parks). Hedge funds have recently increased their positions, betting that the valuation—currently trading at roughly 16x 2026 earnings—is attractive compared to historical norms of 18-20x. However, some institutional investors remain on the sidelines, waiting to see if the new ESPN service can offset the losses from the traditional cable business.

    Regulatory, Policy, and Geopolitical Factors

    Disney remains sensitive to global geopolitics. The Disney Shanghai and Hong Kong resorts are subject to the complexities of U.S.-China relations. Domestically, the company has successfully navigated past political tensions in Florida, but it remains a high-profile target in "culture war" debates, which requires a delicate balancing act from the communications and legal teams. Additionally, evolving copyright laws (such as the expiration of early Mickey Mouse copyrights) require the company to constantly innovate and protect its newer IP.

    Conclusion

    The Walt Disney Company of 2026 is a leaner, more focused version of its former self. By achieving streaming profitability and securing a clear succession plan, it has answered many of the existential questions that dogged it in 2023 and 2024. However, the battle for the future of the Magic Kingdom is far from over. Investors must weigh the declining legacy television business against the massive growth potential of the Experiences segment and the new digital ESPN. For those with a long-term horizon, Disney remains the premier "IP powerhouse," but the coming years under Josh D’Amaro will determine if the company can once again deliver the market-beating returns that defined its past.


    This content is intended for informational purposes only and is not financial advice.

  • The Great Pivot: A Deep Dive into Tesla’s (TSLA) Shift to Physical AI and Robotics

    The Great Pivot: A Deep Dive into Tesla’s (TSLA) Shift to Physical AI and Robotics

    As of February 5, 2026, Tesla Inc. (NASDAQ: TSLA) finds itself at the most critical juncture in its twenty-year history. Once viewed primarily as a disruptor of the internal combustion engine, the company has spent the last 24 months aggressively shedding its skin as a traditional automaker. Today, Tesla is increasingly valued and analyzed as a "Physical AI" and robotics conglomerate. With the recent release of its Q4 2025 earnings and the imminent mass production of its autonomous "Cybercab," Tesla’s narrative has shifted from quarterly delivery counts to the compute power of its Dojo supercomputer and the dexterity of its Optimus humanoid robots. This transition has polarized Wall Street, creating a high-stakes environment where the company's $1 trillion-plus valuation hinges on its ability to solve the "last mile" of full autonomy.

    Historical Background

    Founded in 2003 by Martin Eberhard and Marc Tarpenning—and later joined and shaped by Elon Musk—Tesla’s journey began with the Roadster, a proof-of-concept that electric vehicles (EVs) could be high-performance and desirable. The 2012 launch of the Model S fundamentally changed the automotive industry, proving that software-defined vehicles were the future.

    The middle of the last decade saw Tesla navigate "production hell" with the Model 3, a period that nearly bankrupted the firm before leading to sustained profitability and its 2020 inclusion in the S&P 500. Between 2022 and 2024, the company faced a "middle-age" crisis as EV demand softened globally and price wars squeezed margins. However, 2025 marked the year of the "Great Pivot," during which Tesla de-prioritized its traditional entry-level hatchback (the long-rumored "Model 2") in favor of a dedicated autonomous platform, signaling its exit from the era of manual driving.

    Business Model

    Tesla’s revenue streams have diversified significantly leading into 2026:

    • Automotive: Despite a pivot to autonomy, the sale of Model 3, Model Y, and Cybertruck remains the primary cash engine. Revenue is supplemented by regulatory credits, though this high-margin stream is slowly tapering as other OEMs ramp up their own EV production.
    • Energy Generation and Storage: This is the fastest-growing segment. Tesla’s Megapack (utility-scale) and Powerwall (residential) systems are benefiting from the global shift toward grid stabilization and renewable energy storage.
    • Services and Other: This includes the massive Supercharger network, which has become the de facto North American charging standard (NACS), and FSD (Full Self-Driving) subscriptions.
    • AI and Robotics (Emerging): In 2026, this segment is transitioning from R&D to commercialization. It includes the Optimus humanoid robot and the "Cybercab" ride-hailing software platform.

    Stock Performance Overview

    Tesla’s stock performance has been a roller coaster of historic proportions:

    • 10-Year Horizon: Investors who held from 2016 have seen returns exceeding 1,500%, far outstripping the S&P 500.
    • 5-Year Horizon: Following the 2020-2021 surge, the stock faced a brutal 2022-2023, losing over 60% of its value before recovering through 2024 and 2025 as the AI narrative took hold.
    • 1-Year Horizon: Over the past 12 months, TSLA has outperformed the broader market, driven by improving margins and optimism surrounding the Optimus Gen 3 production ramp.

    As of early February 2026, the stock trades at a premium forward price-to-earnings (P/E) ratio of approximately 145x, reflecting the market's belief in its future robotics revenue rather than current car sales.

    Financial Performance

    In its Q4 2025 earnings report (released January 28, 2026), Tesla reported total revenue of $24.9 billion. While this was a slight year-over-year decline, the quality of the earnings surprised analysts.

    • Margins: Total gross margin climbed back to 20.1%, up from the mid-teens seen during the 2024 price wars. This was attributed to a massive reduction in cost-per-vehicle and high-margin energy storage sales.
    • Earnings per Share (EPS): Non-GAAP EPS was $0.50, beating the consensus estimate of $0.44.
    • Balance Sheet: Tesla remains "cash rich" with $44.1 billion in liquidity, allowing it to fund a $20 billion capital expenditure program for 2026 without seeking external debt.

    Leadership and Management

    Elon Musk remains the central—and often controversial—figure as CEO. In late 2025 and early 2026, his strategy has focused on "Physical AI." Musk’s governance has been characterized by high-risk, high-reward pivots, such as the decision to discontinue the Model S and Model X lines in early 2026 to repurpose factory space for Optimus production. Supporting Musk is a lean executive team, including CFO Vaibhav Taneja and Tom Zhu, who oversees global operations. The board remains under scrutiny regarding Musk’s multi-billion dollar compensation packages and his time split between Tesla and his other ventures like X (formerly Twitter) and SpaceX.

    Products, Services, and Innovations

    Tesla's product lineup is currently undergoing its most radical refresh:

    • Cybercab (Robotaxi): The crown jewel of Tesla’s autonomous strategy. Production is slated for April 2026. It features no steering wheel or pedals and is built on the "unboxed" manufacturing platform.
    • Optimus Gen 3: Mass production of the humanoid robot began in late January 2026. Initially, these robots are being deployed internally in Tesla factories to replace repetitive manual labor.
    • FSD (Supervised to Unsupervised): FSD has reached version 14.x, moving closer to true Level 4/5 autonomy in select geofenced areas.
    • Energy Storage: The Megapack 2 remains the industry standard for large-scale battery storage, with a massive backlog stretching into 2027.

    Competitive Landscape

    Tesla faces a bifurcated competitive field:

    • Traditional Automotive: In China, BYD (OTC: BYDDY) remains a formidable threat, often outselling Tesla in total volume. In the U.S. and Europe, legacy manufacturers like Ford (NYSE: F) and Volkswagen have slowed their EV investments, giving Tesla more breathing room but also signaling a cooling consumer market.
    • Autonomous Driving: Waymo (Alphabet) is the primary rival in the ride-hailing space, having already established a presence in several U.S. cities. Tesla’s "vision-only" approach (no LiDAR) remains a technological counter-bet to the rest of the industry.
    • Robotics: New entrants from Boston Dynamics and Chinese tech giants like Xiaomi are racing to compete with Optimus.

    Industry and Market Trends

    The "EV Hype" of the early 2020s has matured into a more complex market. High interest rates in 2024-2025 cooled consumer spending on luxury items, forcing a shift toward affordability. Simultaneously, the explosion of Generative AI has moved from the digital realm (LLMs) to the physical realm (Robotics), which is where Tesla is currently positioning itself. The transition to NACS (North American Charging Standard) by almost all major automakers has also solidified Tesla’s "toll booth" status in the EV charging ecosystem.

    Risks and Challenges

    • Execution Risk: The Cybercab and Optimus are "all-in" bets. If the April 2026 production ramp stalls or if the tech fails to meet safety standards, the valuation could collapse.
    • Regulatory Hurdles: Autonomous vehicles require state-by-state and country-by-country approval. Regulatory pushback in key markets like California or the EU could delay the Robotaxi network for years.
    • Key Man Risk: Tesla’s valuation is inextricably linked to Elon Musk. Any change in his leadership or focus remains a primary concern for institutional investors.

    Opportunities and Catalysts

    • FSD Licensing: Several legacy automakers are reportedly in talks to license Tesla’s FSD software, which would create a high-margin, software-as-a-service (SaaS) revenue stream.
    • Energy Arbitrage: As more grids become dependent on renewables, Tesla’s software (Autobidder) for energy storage becomes more valuable.
    • Optimus External Sales: Once Tesla satisfies its internal demand, selling Optimus to external industrial partners could represent a multi-trillion dollar market.

    Investor Sentiment and Analyst Coverage

    Wall Street is split into two camps. The "Bulls" (e.g., Wedbush, Ark Invest) see a $500+ stock price, viewing Tesla as the world’s most advanced AI company. The "Bears" (e.g., Wells Fargo) focus on the 145x P/E ratio and the declining sales of traditional cars, arguing that the stock is dangerously overvalued. Institutional ownership remains high, but retail sentiment is more volatile, often reacting to Musk’s social media presence.

    Regulatory, Policy, and Geopolitical Factors

    Geopolitics plays a massive role in Tesla’s future. The company’s heavy reliance on its Shanghai Gigafactory makes it vulnerable to U.S.-China trade tensions. Furthermore, the outcome of recent U.S. policy shifts regarding the Inflation Reduction Act (IRA) and EV tax credits has created a shifting landscape for consumer incentives. In Europe, anti-subsidy investigations into Chinese-made EVs (including Teslas) continue to pose a tariff risk.

    Conclusion

    Tesla in 2026 is no longer just a car company; it is an ambitious experiment in large-scale AI deployment. While the automotive fundamentals are stabilizing with healthy 20% margins, the "Tesla story" has moved to the factory floor (Optimus) and the autonomous streets (Cybercab). Investors must weigh the company’s proven ability to disrupt industries against the monumental technical and regulatory challenges of full autonomy. The coming twelve months—specifically the April production ramp—will likely determine if Tesla justifies its trillion-dollar valuation or if the robotics dream remains a distant horizon.


    This content is intended for informational purposes only and is not financial advice. All data and projections are based on the current market environment as of February 5, 2026.

  • The $1 Trillion Apothecary: A Deep-Dive Research Report on Eli Lilly (LLY)

    The $1 Trillion Apothecary: A Deep-Dive Research Report on Eli Lilly (LLY)

    As of February 5, 2026, Eli Lilly and Company (NYSE: LLY) stands as a paradigm-shifting titan in the global healthcare landscape. Having recently crossed the historic $1 trillion market capitalization threshold, the Indianapolis-based pharmaceutical giant has transitioned from a legacy drugmaker into a high-growth biotechnology powerhouse. Driven primarily by its leadership in the incretin space—specifically the dual-agonist tirzepatide—Lilly has redefined the treatment of obesity and type 2 diabetes. Today, the company is in focus not only for its financial dominance but for its role in a societal health shift, as it scales manufacturing to meet unprecedented global demand while expanding its reach into Alzheimer’s disease and immunology.

    Historical Background

    Founded in 1876 by Colonel Eli Lilly, a chemist and Civil War veteran, the company was built on the principle of providing high-quality pharmaceutical products at a time when "patent medicines" were often unreliable. Early milestones included the 1923 commercialization of insulin, the first such effort in the world, which established Lilly’s enduring dominance in metabolic health.

    Throughout the 20th century, Lilly expanded its repertoire with breakthroughs such as the antibiotic erythromycin and the iconic antidepressant Prozac (fluoxetine) in the 1980s. The 2010s were a period of transformation, as the company moved through a "patent cliff" and successfully pivoted toward biologics and specialized oncology treatments. This historical commitment to R&D laid the groundwork for the 2022 and 2023 approvals of Mounjaro and Zepbound, which have become the fastest-growing drugs in pharmaceutical history.

    Business Model

    Eli Lilly operates a vertically integrated pharmaceutical business model focused on discovery, development, manufacturing, and marketing of human medicines. Its revenue is concentrated in four key therapeutic areas:

    • Diabetes and Obesity (Metabolic Health): The core engine of growth, representing over 60% of total revenue via the tirzepatide franchise.
    • Oncology: Focused on targeted therapies like Verzenio for breast cancer.
    • Immunology: Led by Taltz and Olumiant, treating conditions like psoriasis and rheumatoid arthritis.
    • Neuroscience: A resurgent segment following the launch of Kisunla (donanemab) for early-stage Alzheimer’s.

    Lilly’s model increasingly emphasizes high-volume, chronic-use medications that require sophisticated large-scale manufacturing, moving away from the "niche orphan drug" strategy favored by some peers.

    Stock Performance Overview

    Lilly’s stock performance has been nothing short of meteoric. Over the 1-year horizon (Feb 2025 – Feb 2026), LLY shares have appreciated by approximately 40%, fueled by consistent quarterly "beat-and-raise" reports and the successful launch of its direct-to-consumer delivery platform.

    On a 5-year basis, the stock has outperformed the S&P 500 by over 500%, reflecting its transition from a dividend-oriented value play to a premier growth stock. The 10-year performance reveals a transformation where a $10,000 investment in 2016 would be worth over $120,000 today, factoring in dividends. Notable moves include the massive 2023–2024 breakout as clinical data for tirzepatide in sleep apnea and heart failure expanded the drug's addressable market.

    Financial Performance

    Fiscal Year 2025 was a record-breaking year for Eli Lilly. The company reported total revenue of $65.18 billion, a staggering 45% increase over 2024.

    • Earnings per Share (EPS): Non-GAAP EPS for 2025 reached $24.21, more than doubling the prior year’s result.
    • Margins: Gross margins remain robust at 83.2%, though operating margins have seen slight pressure due to a massive $55 billion multi-year capital expenditure program for manufacturing.
    • Valuation: LLY trades at a premium forward P/E ratio of approximately 35x 2026 estimates, reflecting the market's high expectations for its oral GLP-1 pipeline.
    • Debt and Cash Flow: The company maintains a strong balance sheet with $12 billion in operating cash flow, allowing it to self-fund expansion while maintaining a growing dividend.

    Leadership and Management

    Under the leadership of David Ricks (CEO), who took the helm in 2017, Lilly has become a masterclass in strategic focus. Ricks is credited with narrowing the company’s R&D focus to high-impact "moonshots" and aggressively investing in manufacturing years before the GLP-1 craze took hold. The management team is highly regarded for its transparency and operational excellence, particularly in navigating the complex supply chain challenges of 2024. The board remains focused on long-term value, resisting short-term margin expansion in favor of building a dominant, "un-replicable" manufacturing moat.

    Products, Services, and Innovations

    Lilly's current portfolio is anchored by Mounjaro (diabetes) and Zepbound (obesity). Both utilize tirzepatide, a dual GIP and GLP-1 receptor agonist that has shown superior weight loss efficacy compared to first-generation treatments.

    • Kisunla (Donanemab): A recently launched Alzheimer’s treatment that clears amyloid plaques, notably allowing patients to stop treatment once plaques are removed—a key competitive edge.
    • Innovation Pipeline: The most watched asset is Orforglipron, an oral "small molecule" GLP-1 agonist currently under FDA review. Unlike injectable peptides, this pill can be manufactured using standard chemical synthesis, potentially lowering costs and increasing global access.
    • Retatrutide: A "triple agonist" (GLP-1/GIP/Glucagon) in Phase 3 trials, which has demonstrated weight loss of up to 29% in clinical studies, aiming to set a new "gold standard" for the late 2020s.

    Competitive Landscape

    The metabolic market is currently a "duopoly" between Eli Lilly and Novo Nordisk (NYSE: NVO). As of early 2026, Lilly has gained the upper hand in the U.S. market, capturing a 60.5% share of new GLP-1 prescriptions. While Novo Nordisk’s Wegovy remains a formidable competitor, Lilly’s dual-agonist profile and aggressive capacity expansion have allowed it to outpace its Danish rival in supply reliability. Other competitors like Pfizer (NYSE: PFE), Amgen (NASDAQ: AMGN), and Roche are racing to bring oral or monthly injectable alternatives to market, but they currently lag Lilly by 3 to 5 years in clinical development and manufacturing scale.

    Industry and Market Trends

    Three major trends are currently driving the sector:

    1. Obesity as Chronic Disease: Shifting societal and medical views have categorized obesity as a lifelong metabolic condition rather than a lifestyle choice, ensuring long-term patient retention.
    2. Manufacturing as a Moat: In the era of biologics, the ability to build and operate multi-billion dollar "mega-factories" has become a greater barrier to entry than patent protection alone.
    3. Expansion into Comorbidities: GLP-1 drugs are being proven to treat sleep apnea, fatty liver disease (MASH), and chronic kidney disease, exponentially growing the patient pool.

    Risks and Challenges

    Despite its dominance, Lilly faces significant hurdles:

    • Pricing Pressure: The U.S. government’s "TrumpRx" initiative and Medicare negotiations have forced "low-to-mid teens" price declines for branded metabolic drugs.
    • Manufacturing Complexity: Managing $55 billion in new facilities across several countries introduces significant execution risk; any contamination or delay at a major site could impact revenue.
    • Side Effect Scrutiny: Long-term data on rare side effects (e.g., gastroparesis) remains a focus for regulators and trial lawyers.
    • Valuation Risk: With a $1 trillion market cap, the "priced for perfection" stock is sensitive to any clinical trial setbacks or earnings misses.

    Opportunities and Catalysts

    • Orforglipron FDA Approval: Expected in Q2 2026, this could be the single largest catalyst for the year, unlocking the massive oral weight-loss market.
    • International Expansion: High-margin launches in the EU and Asia are just beginning to contribute to the bottom line.
    • Retatrutide Data: Continued Phase 3 readouts in 2026 could confirm Lilly's lead in efficacy for the next decade.
    • Direct-to-Consumer Growth: LillyDirect, the company’s telehealth and pharmacy platform, is capturing a higher portion of the retail margin by cutting out traditional middlemen.

    Investor Sentiment and Analyst Coverage

    Wall Street sentiment on LLY remains overwhelmingly "Bullish." Approximately 82% of analysts rate the stock a "Strong Buy." Following the February 2026 earnings beat, price targets were revised upward, with consensus landing between $1,200 and $1,300. Institutional ownership remains high, with major funds viewing Lilly as a "must-own" cornerstone of healthcare portfolios. While some retail "chatter" warns of a bubble, institutional investors point to the company's 45% revenue growth as a fundamental justification for its premium valuation.

    Regulatory, Policy, and Geopolitical Factors

    In early 2026, Lilly successfully navigated a landmark agreement with the U.S. Administration to ensure widespread access to obesity medications in exchange for pricing concessions. This has largely mitigated the threat of "march-in rights" or aggressive patent challenges. Geopolitically, Lilly’s focus on onshore manufacturing in Indiana, North Carolina, and Virginia has insulated it from supply chain shocks related to China or European energy costs, a strategy that has earned it significant political goodwill in Washington.

    Conclusion

    Eli Lilly has evolved into more than just a pharmaceutical company; it is now a fundamental infrastructure provider for global metabolic health. With 2026 revenue projected to exceed $80 billion and a pipeline that includes the potential for the first "triple-agonist" weight-loss drug, Lilly’s momentum appears sustainable. Investors must weigh the stock's premium valuation against its unprecedented growth rate and manufacturing moat. For those looking at the long horizon, Lilly’s transition into neuroscience and its upcoming oral GLP-1 launch suggest that the "Trillion Dollar Era" for the company is not a peak, but a new baseline.


    This content is intended for informational purposes only and is not financial advice.

  • The AI Infrastructure Titan: A 2026 Deep-Dive into Microsoft (MSFT)

    The AI Infrastructure Titan: A 2026 Deep-Dive into Microsoft (MSFT)

    As of February 5, 2026, Microsoft Corp. (MSFT: NASDAQ) finds itself at a pivotal crossroads in the "AI Supercycle." After a decade of unprecedented growth under the leadership of Satya Nadella, the technology titan has transitioned from a software provider to the world’s most significant AI infrastructure powerhouse. While the company recently ceded its position as the world's most valuable company to Nvidia following a volatile January, Microsoft remains the cornerstone of the modern enterprise. With a market capitalization of approximately $3.08 trillion, the company's influence spans from the fundamental architecture of the internet to the productivity tools used by over a billion people. This report explores Microsoft's current standing, its aggressive pivot into custom silicon, and the financial tightrope it walks between massive capital investment and high-margin AI monetization.

    Historical Background

    Founded in 1975 by Bill Gates and Paul Allen, Microsoft’s early history was defined by the democratization of the personal computer through the MS-DOS and Windows operating systems. The 1990s and early 2000s saw the company dominate the desktop era, though it faced significant antitrust scrutiny and a perceived "lost decade" under Steve Ballmer where it struggled to adapt to the mobile revolution.

    The turning point came in 2014 when Satya Nadella took the helm. Nadella pivoted the company toward a "mobile-first, cloud-first" strategy, famously embracing open source and competitors like Linux. This cultural and strategic shift led to the meteoric rise of Azure and the transformation of Office into the subscription-based Microsoft 365. By 2023, the company entered its third major era: the "AI-first" era, signaled by a multi-billion dollar investment in OpenAI and the rapid integration of generative AI across its entire product stack.

    Business Model

    Microsoft operates a diversified and highly resilient business model divided into three primary segments:

    1. Intelligent Cloud: This is the company's growth engine, encompassing Azure, SQL Server, and enterprise services. Azure provides the compute and storage infrastructure for the world’s AI models, including those of OpenAI.
    2. Productivity and Business Processes: This segment includes the Microsoft 365 suite (Word, Excel, PowerPoint), LinkedIn, and Dynamics 365. The business model has shifted toward high-margin per-user subscriptions, augmented by the new "Copilot" AI add-ons.
    3. More Personal Computing: This includes Windows OEM licensing, Surface hardware, and the Xbox gaming ecosystem. Following the 2023 acquisition of Activision Blizzard, this segment has become a gaming behemoth, focusing on the Game Pass subscription model rather than just hardware sales.

    Stock Performance Overview

    Microsoft’s stock performance reflects a decade of consistent execution followed by recent AI-driven volatility.

    • 10-Year Performance: MSFT has been one of the greatest wealth creators in history, returning approximately 720% since 2016 (a 23% CAGR).
    • 5-Year Performance: The stock is up roughly 72%, driven by the acceleration of cloud adoption during the pandemic and the initial AI hype in 2023.
    • 1-Year Performance: Over the past twelve months, the stock has been relatively flat to down slightly (-3.6%). While Microsoft reached record highs in late 2025, a recent 10% post-earnings correction in January 2026—the steepest since 2020—has cooled the rally as investors digest the high costs of AI infrastructure.

    Financial Performance

    In its latest Q2 FY2026 results (ended December 31, 2025), Microsoft reported a robust "double beat":

    • Revenue: $81.3 billion, up 17% year-over-year.
    • Net Income: GAAP net income surged 60% to $38.5 billion, though this was heavily influenced by a $7.6 billion accounting gain from its OpenAI stake. On a non-GAAP basis, net income rose a healthy 23%.
    • Margins: Operating margins remain elite at over 40%, though they face downward pressure from massive capital expenditures (CapEx) required to build AI data centers.
    • Backlog: The commercial backlog (RPO) has swelled to $625 billion, a testament to long-term enterprise commitment to Microsoft’s cloud ecosystem.

    Leadership and Management

    Satya Nadella continues to serve as Chairman and CEO, widely regarded as one of the most effective CEOs in corporate history. However, 2025 and early 2026 have seen strategic reshuffling to address emerging threats:

    • Judson Althoff was promoted to CEO of Microsoft Commercial Business in late 2025, signaling a focus on global sales scaling.
    • Hayete Gallot rejoined as EVP of Security in February 2026. This is a critical hire intended to restore trust following several high-profile security breaches in 2024.
    • Charlie Bell, the former AWS veteran, has been moved to lead the "Quality Excellence Initiative," focusing on the underlying engineering rigor of Microsoft’s sprawling software empire.

    Products, Services, and Innovations

    Microsoft's current innovation pipeline is focused on Vertical Integration.

    • Copilot 2.0: Microsoft 365 Copilot has matured into a multi-agent system, currently boasting 15 million paid seats.
    • Custom Silicon: To reduce reliance on Nvidia and lower costs, Microsoft debuted the Maia 200 (AI inference chip) and Cobalt 200 (cloud CPU) in early 2026. These chips are designed specifically for Azure workloads, offering a 30% improvement in total cost of ownership.
    • GitHub Copilot: With 4.7 million subscribers, GitHub has become the "AI developer’s home," proving that Microsoft can successfully monetize AI in niche professional markets.

    Competitive Landscape

    The battle for "Hyperscale" dominance remains fierce:

    • Cloud: Azure holds approximately 23–25% of the market, still trailing Amazon’s (AMZN) AWS (31–32%) but significantly ahead of Google Cloud (GOOGL).
    • AI: While Microsoft has a first-mover advantage via OpenAI, it faces intense competition from Google’s Gemini and Meta’s (META) Llama ecosystem, which promotes open-source AI as an alternative to Microsoft’s proprietary models.
    • Gaming: In the console space, Xbox continues to trail Sony’s PlayStation, but Microsoft is successfully shifting the narrative toward "content and services" following the Activision integration.

    Industry and Market Trends

    The primary trend dominating the sector is the shift from AI experimentation to AI production. Enterprises are no longer just "testing" LLMs; they are integrating them into core workflows. However, this has led to "capacity constraints" in the cloud. Microsoft’s Azure growth (39% this quarter) would likely have been higher if the company had enough physical hardware to meet demand. Additionally, "Sovereign Clouds"—localized data centers that satisfy national data privacy laws—are becoming a major growth driver in Europe and the Middle East.

    Risks and Challenges

    • The "Nvidia Tax" and CapEx: Microsoft is spending tens of billions of dollars annually on AI infrastructure. If the revenue from Copilot and AI services doesn't scale as fast as the depreciation of these assets, margins will suffer.
    • Security Vulnerabilities: Microsoft has faced persistent criticism for its security posture. Another major breach could drive enterprise customers toward Google Cloud or AWS.
    • OpenAI Dependency: While the partnership is lucrative, any internal instability at OpenAI or a shift in their partnership terms represents a single-point-of-failure risk for Microsoft’s AI strategy.

    Opportunities and Catalysts

    • Capacity Expansion: As Microsoft’s new data centers come online in late 2026, the current "capacity constraints" will ease, potentially re-accelerating Azure growth.
    • Gaming Monetization: The full integration of the Activision Blizzard library into Game Pass is expected to drive a surge in subscription revenue by late 2026.
    • In-house Silicon: The transition to Maia 200 chips could significantly boost Azure’s profitability by 2027 by reducing the high "rent" paid for third-party GPUs.

    Investor Sentiment and Analyst Coverage

    Wall Street remains overwhelmingly bullish, despite the recent stock price dip. The consensus rating is a "Strong Buy" with an average price target of $593.28, representing significant upside from current levels. Analysts largely view the recent correction as a "healthy reset" of expectations. Institutional ownership remains high, with major funds viewing MSFT as the safest "all-weather" bet in the technology sector.

    Regulatory, Policy, and Geopolitical Factors

    Regulatory headwinds are shifting. While the Teams unbundling issue in the EU was settled in late 2025, new challenges have emerged:

    • AI "Acqui-hiring": The FTC and DOJ are investigating Microsoft’s practice of hiring talent from AI startups (like Inflection AI) as a way to circumvent traditional merger reviews.
    • Digital Markets Act (DMA): Ongoing compliance in the EU requires Microsoft to keep its ecosystem more "open" than in previous decades, which may limit its ability to lock in users.
    • Geopolitics: Trade restrictions on high-end AI chips to China remain a wildcard, though Microsoft’s primary exposure is through its cloud services rather than direct hardware sales.

    Conclusion

    Microsoft enters the mid-2020s as a titan that has successfully reinvented itself for the third time. By tethering its future to the AI revolution and the OpenAI ecosystem, it has secured its place at the center of the enterprise world. While the "CapEx concern" and recent stock volatility suggest that the market is demanding more tangible proof of AI profitability, Microsoft’s $625 billion backlog and 15 million Copilot seats provide a formidable foundation. Investors should watch Azure's capacity expansion and the rollout of custom Maia silicon as the key indicators of whether Microsoft can maintain its elite margin profile in an increasingly expensive AI world.


    This content is intended for informational purposes only and is not financial advice.

  • The Omaha Giant at a Crossroads: A 2026 Deep-Dive into Union Pacific Corporation (UNP)

    The Omaha Giant at a Crossroads: A 2026 Deep-Dive into Union Pacific Corporation (UNP)

    Today’s Date: January 28, 2026

    Introduction

    As we enter the first quarter of 2026, Union Pacific Corporation (NYSE: UNP) finds itself at the center of the most significant upheaval in the North American railroad industry since the late 1990s. While most large-cap industrial companies are navigating a shifting macroeconomic landscape of "higher for longer" interest rates and a cooling manufacturing sector, Union Pacific is engaged in a high-stakes chess match with federal regulators over its proposed $85 billion merger with Norfolk Southern (NYSE: NSC).

    In its latest earnings report released just yesterday, January 27, 2026, Union Pacific demonstrated why it remains the gold standard of freight efficiency. Despite a slight miss on fourth-quarter earnings-per-share estimates, the company reported record full-year net income of $7.1 billion. This article provides a comprehensive deep-dive into the "Omaha Giant," examining whether its pursuit of the first true transcontinental railroad will propel it to new heights or lead to a protracted regulatory quagmire.

    Historical Background

    Union Pacific is more than just a railroad; it is a foundational pillar of the American economy. Its history began with the Pacific Railroad Act of 1862, signed into law by President Abraham Lincoln during the height of the Civil War. The goal was to connect the Atlantic and Pacific coasts, a feat achieved in 1869 when Union Pacific met the Central Pacific Railroad at Promontory Summit, Utah.

    Throughout the 20th century, the company underwent a series of massive transformations that consolidated the Western rail landscape. Key milestones include:

    • 1982: The merger with Missouri Pacific and Western Pacific, which significantly expanded its footprint in the South and West.
    • 1995-1996: The acquisitions of Chicago and North Western and Southern Pacific. These moves created the Western duopoly that exists today between Union Pacific and BNSF Railway.

    Over the last decade, the company has pivoted from a volume-focused strategy to an efficiency-first model known as Precision Scheduled Railroading (PSR), which has radically reshaped its profitability and service metrics.

    Business Model

    Union Pacific operates approximately 32,000 route miles across 23 states in the western two-thirds of the United States. Its revenue model is diversified across three primary freight segments:

    1. Industrial: This is the company’s largest revenue driver, encompassing chemicals, plastics, forest products, and minerals. UNP leverages its proximity to the Gulf Coast petrochemical complex to maintain high-margin long-haul contracts.
    2. Bulk: This segment includes grain, fertilizers, and energy products (coal and renewables). While coal has faced a long-term decline, UNP’s bulk segment has remained resilient due to a 2025 surge in grain exports to Mexico and specialized renewable diesel shipments.
    3. Premium: Comprising Intermodal (containers) and Automotive traffic. This segment is highly sensitive to consumer spending and competition from the trucking industry. Union Pacific owns or operates the most efficient gateways into Mexico, making it a critical link for the North American automotive supply chain.

    Stock Performance Overview

    Over the past decade, Union Pacific has been a cornerstone of "Dividend Aristocrat" portfolios, though recent years have seen increased volatility.

    • 10-Year Performance: UNP has significantly outperformed the S&P 500 on a total return basis over the last decade, driven by aggressive share buybacks and a compounding dividend.
    • 5-Year Performance: The stock saw substantial gains during the post-pandemic supply chain crunch but leveled off in 2024-2025 as the industry grappled with labor negotiations and cooling freight demand.
    • 1-Year Performance: The last 12 months have been defined by "merger mania." The stock spiked in mid-2025 on the Norfolk Southern merger announcement but has recently faced a 5% pullback following the Surface Transportation Board’s (STB) rejection of the initial merger application on January 16, 2026.

    Financial Performance

    For the full year 2025, Union Pacific reported:

    • Net Income: $7.1 billion (a 6% increase year-over-year).
    • Earnings Per Share (EPS): $11.98.
    • Operating Ratio (OR): 59.3%. This is a critical metric for railroads; a lower number indicates higher efficiency. UNP’s sub-60% OR remains the envy of the industry.

    However, the Q4 2025 results revealed some cracks. The company reported an adjusted EPS of $2.86, missing the consensus analyst estimate of $2.88. This was largely attributed to a "negative business mix"—a rise in lower-margin intermodal volume coupled with a decline in higher-margin automotive shipments due to high interest rates impacting car sales.

    Leadership and Management

    The resurgence of Union Pacific’s operational efficiency is widely credited to CEO Jim Vena, who took the helm in August 2023. Vena, a disciple of the legendary railroader Hunter Harrison, has moved the company toward a "Safety, Service, and Operational Excellence" (SSOE) strategy.

    Unlike predecessors who cut assets to the absolute minimum, Vena has introduced the "Buffer Strategy." He maintains a surplus of locomotives and crews to ensure that the railroad can handle sudden volume spikes or extreme weather without the service meltdowns that plagued the industry in 2022. This leadership approach has significantly improved employee morale and restored trust with large industrial shippers.

    Products, Services, and Innovations

    Union Pacific is moving beyond traditional rail services through several technological and structural innovations:

    • The Laredo Gateway: UNP remains the only railroad to serve all six major Mexico gateways, with Laredo serving as the crown jewel. Its "Falcon Premium" service, partnered with Canadian National (NYSE: CNI), provides the fastest rail service between Mexico and Chicago.
    • Net-Zero Initiatives: UNP is currently testing high-horsepower hydrogen-locomotive prototypes and has invested heavily in "Precision Dispatch" software to optimize fuel consumption.
    • Autonomous Yard Operations: The company is slowly rolling out autonomous technology in its sorting yards to reduce human error and improve safety in high-risk environments.

    Competitive Landscape

    The primary rival remains BNSF Railway, owned by Berkshire Hathaway (NYSE: BRK.A). While BNSF has a larger share of the northern grain corridors, Union Pacific maintains a superior Operating Ratio and higher profitability per carload.

    The newest threat is CPKC (NYSE: CP), the result of the Canadian Pacific and Kansas City Southern merger. CPKC offers the only single-line rail service connecting Canada, the U.S., and Mexico. Union Pacific’s proposed merger with Norfolk Southern is viewed by many as a direct competitive response to CPKC, seeking to create a similarly seamless East-West network.

    Industry and Market Trends

    The "Reshoring" and "Nearshoring" trends are the most significant macro drivers for UNP. As manufacturing moves from China to Mexico and the American South, Union Pacific’s network is perfectly positioned to capture the resulting freight flows. However, the industry is currently battling a "Freight Recession" in the trucking sector, where low truck rates have lured some intermodal shippers away from the rails.

    Risks and Challenges

    • Regulatory Obstacles: The Surface Transportation Board (STB) is increasingly skeptical of consolidation. The January 16 rejection of the Norfolk Southern merger application cited "incomplete market impact analyses."
    • Safety and Public Perception: Following the East Palestine derailment (by Norfolk Southern), the entire industry is under microscopic safety scrutiny. Any major derailment for UNP could lead to punitive new regulations.
    • Labor Relations: While a strike was averted in late 2022, labor unions remain vocal about sick leave and crew consist (the number of people on a train).

    Opportunities and Catalysts

    • The "Great Connection": If UNP successfully refiles and wins approval for the Norfolk Southern merger by late 2026, it would create a monopolistic advantage for transcontinental shipping, allowing it to bypass the costly "Chicago handoff."
    • Energy Transition: While coal is fading, the transport of lithium for batteries, wind turbine components, and biofuels represents a multi-billion dollar growth vertical.
    • Capital Allocation: UNP remains committed to returning nearly 100% of its free cash flow to shareholders via dividends and buybacks.

    Investor Sentiment and Analyst Coverage

    Wall Street is currently divided on UNP. Institutional heavyweights like Vanguard and BlackRock remain "overweight," viewing the stock as a defensive play with a massive "moat." However, some analysts have recently downgraded the stock to "Hold" until there is more clarity on the Norfolk Southern merger. The consensus price target sits around $265, suggesting modest upside from current levels unless the regulatory environment shifts favorably.

    Regulatory, Policy, and Geopolitical Factors

    The outcome of the 2024 U.S. Presidential election continues to resonate in early 2026, with trade policies toward Mexico being the primary variable for UNP. Any tariffs on Mexican-made autos would directly impact UNP’s Premium segment. Additionally, the STB’s "Reciprocal Switching" rules—which could force railroads to share tracks with competitors—remain a looming threat to profit margins.

    Conclusion

    Union Pacific Corporation stands at a crossroads. Financially, the company is a powerhouse, boasting best-in-class margins and a disciplined management team under Jim Vena. Operationally, it is more resilient than it has been in decades. However, its future valuation is now inextricably tied to its ability to convince regulators that a transcontinental merger is in the public interest.

    For investors, UNP remains a quintessential "bedrock" stock. It offers a combination of a 2.5% dividend yield and exposure to the long-term industrialization of the North American continent. The next six months—leading up to the June 22 deadline for the revised merger filing—will be the most critical period for the stock in a generation. Investors should watch Operating Ratio trends and STB commentary closely, as these will be the primary drivers of volatility in 2026.


    This content is intended for informational purposes only and is not financial advice.

  • The Silent Architect of the AI Era: A Deep Dive into Amphenol Corporation (APH)

    The Silent Architect of the AI Era: A Deep Dive into Amphenol Corporation (APH)

    As of January 28, 2026, Amphenol Corporation (NYSE: APH) has solidified its reputation as one of the most consistent compounders in the industrial and technology sectors. Often described as the "silent backbone" of the digital age, Amphenol does not produce flashy consumer gadgets; instead, it provides the essential interconnects, sensors, and antenna systems that make modern life possible. From the high-speed data centers powering generative AI to the complex wiring of the latest commercial aircraft, Amphenol’s components are ubiquitous. Following its blockbuster FY 2025 earnings report released this morning, the company is in the spotlight for its unprecedented growth and its massive $10.5 billion acquisition of CommScope’s Connectivity and Cable Solutions (CCS) business, which closed earlier this month.

    Historical Background

    Founded in 1932 by Arthur J. Schmitt as the American Phenolic Corporation, the company’s first major success was a molded radio tube socket that revolutionized the radio industry. During World War II, Amphenol became a critical supplier of connectors for military hardware, establishing a "harsh environment" expertise that remains a core competency today.

    The modern era of Amphenol began in the late 1980s and early 1990s. After being acquired by LPL Investment Group in 1987, the company went public on the New York Stock Exchange in 1991. A pivotal moment occurred in 1997 when the private equity giant Kohlberg Kravis Roberts & Co. (KKR) acquired a majority stake for $1.5 billion. Under KKR's influence, Amphenol refined its aggressive acquisition strategy and its unique decentralized management structure. By the time KKR exited its position in the mid-2000s, Amphenol had transformed into a global powerhouse capable of integrating dozens of smaller companies while maintaining high margins.

    Business Model

    Amphenol operates under a highly unusual and effective business model: extreme decentralization. The company is comprised of more than 130 independent business units. Each unit is led by a General Manager who has complete P&L responsibility, including engineering, manufacturing, and sales. This "Amphenolian" culture avoids the bureaucracy of typical large corporations, allowing the company to react with the speed of a startup while leveraging the scale of a Fortune 500 giant.

    Revenue is diversified across three main segments:

    • Harsh Environment Solutions: Connectors and cables for military, aerospace, and industrial use.
    • Communications Solutions: High-speed interconnects and fiber optics for IT/Datacom and mobile networks.
    • Interconnect and Sensor Systems: Specialized sensors for automotive, medical, and industrial applications.

    The company’s growth is driven by a "buy-and-build" strategy, where it continuously acquires "tuck-in" companies that add specialized technology or expand its geographic reach.

    Stock Performance Overview

    Amphenol has been an extraordinary performer for long-term shareholders. Over the past decade, it has consistently outperformed the S&P 500 and most of its industrial peers.

    • 1-Year Performance: As of January 2026, the stock is up approximately 140% year-over-year, driven largely by the AI infrastructure boom and the successful integration of the Carlisle Interconnect Technologies acquisition.
    • 5-Year Performance: The total return stands at roughly 376%, reflecting steady margin expansion and earnings growth.
    • 10-Year Performance: Long-term investors have seen a staggering 1,320% return, illustrating the power of compounding in a well-executed decentralized model.
      Today, shares trade near all-time highs of $166.25, reflecting a market cap that has swelled significantly over the past 24 months.

    Financial Performance

    In the fiscal year 2025 results reported on January 28, 2026, Amphenol shattered expectations:

    • Annual Revenue: $23.1 billion, a 52% increase over FY 2024.
    • Earnings Per Share (EPS): Adjusted Diluted EPS reached $3.34, up 77% from the prior year.
    • Operating Margins: The company achieved record adjusted operating margins of 26.2%.
    • Cash Flow: Free cash flow remained robust, allowing the company to fund its $10.5 billion CommScope CCS acquisition while maintaining a manageable net debt-to-EBITDA ratio.
      The company’s valuation remains high, with a forward P/E of approximately 41x, a premium that reflects its consistent "beat and raise" track record.

    Leadership and Management

    CEO R. Adam Norwitt has been at the helm since 2009 and is widely regarded as one of the best operators in the industrial sector. Having been with the company for nearly 30 years, Norwitt is the primary architect of the current decentralized culture. His strategy focuses on operational discipline, localized decision-making, and a relentless focus on high-margin, high-tech niches. The management team is characterized by extreme longevity, with many business unit leaders having spent their entire careers within the Amphenol ecosystem.

    Products, Services, and Innovations

    Innovation at Amphenol happens at the business-unit level rather than in a centralized R&D lab. This keeps innovation closely tied to customer needs.

    • AI and Datacom: Amphenol is a leader in 800G and 1.6T interconnect systems, which are essential for the next generation of AI clusters. Their Linear Pluggable Optics (LPO) solutions are currently a market favorite for reducing power consumption in data centers.
    • Aerospace Electrification: Following the $2.025 billion acquisition of Carlisle Interconnect Technologies in 2024, Amphenol has become a dominant force in high-voltage wiring for the "more electric" aircraft of the future.
    • Sensors: The company’s sensor portfolio includes advanced thermal, pressure, and position sensors used in autonomous driving systems and medical diagnostic equipment.

    Competitive Landscape

    Amphenol’s primary competitor is TE Connectivity (NYSE: TEL). While TE Connectivity is also a formidable global player, it is more centralized and has a significantly higher exposure to the automotive sector (roughly 40% of its revenue). Amphenol’s decentralized model generally allows it to pivot faster toward emerging trends like AI or specialized defense applications. Other competitors include Molex (a subsidiary of Koch Industries) and smaller specialized players like Huber+Suhner. Amphenol typically wins on its ability to provide highly customized solutions rather than mass-market commodity connectors.

    Industry and Market Trends

    Several macro trends are currently favoring Amphenol:

    • AI Infrastructure: The massive build-out of data centers to support large language models (LLMs) requires an unprecedented amount of high-speed cabling and connectors.
    • Electrification of Everything: Beyond EVs, the electrification of industrial equipment and aerospace is creating a "content gain" opportunity for Amphenol.
    • Fiber-to-the-X (FTTX): The 2026 completion of the CommScope CCS acquisition makes Amphenol a primary beneficiary of global government spending on broadband infrastructure and 5G/6G rollouts.

    Risks and Challenges

    Despite its stellar performance, Amphenol faces several risks:

    • Integration Risk: The $10.5 billion CommScope CCS deal is the largest in the company's history. Integrating a business of this size is a departure from its usual "tuck-in" strategy and could strain the decentralized model.
    • Valuation: Trading at over 40x forward earnings, the stock has little room for error. Any miss in earnings or guidance could lead to a significant valuation reset.
    • Supply Chain and Geopolitics: With a global manufacturing footprint, Amphenol is sensitive to trade tensions, particularly between the U.S. and China, and potential disruptions in the supply of raw materials like copper and gold.

    Opportunities and Catalysts

    • Accretion from CommScope: Analysts expect the CommScope CCS business to be significantly more profitable under Amphenol’s lean management style, providing a massive earnings tailwind in 2026 and 2027.
    • Next-Gen AI Clusters: As Nvidia and others move toward even more dense GPU architectures, the demand for Amphenol’s high-performance interconnects is expected to grow exponentially.
    • Defense Spending: Increased global geopolitical tensions are driving higher defense budgets, particularly in electronic warfare and communication systems where Amphenol excels.

    Investor Sentiment and Analyst Coverage

    Wall Street sentiment is overwhelmingly bullish. Following the January 28, 2026 earnings call, several major banks, including JPMorgan and Goldman Sachs, raised their price targets to the $180-$200 range. The consensus rating is a "Strong Buy." Institutional ownership remains high, with major funds viewing Amphenol as a core holding that provides exposure to high-growth tech trends with the stability of an industrial powerhouse.

    Regulatory, Policy, and Geopolitical Factors

    Amphenol is navigating a complex regulatory landscape. The company benefits from the U.S. CHIPS Act and various green energy subsidies that encourage domestic manufacturing and electrification. However, it also faces scrutiny over its global supply chain. Compliance with evolving environmental, social, and governance (ESG) standards is a focus, particularly regarding the carbon footprint of its manufacturing processes and the sourcing of "conflict minerals."

    Conclusion

    Amphenol Corporation stands at the pinnacle of the industrial technology sector in early 2026. Its unique decentralized business model has proven to be an engine for consistent, high-margin growth. While the scale of its recent acquisitions brings new integration challenges and its valuation remains at a premium, the company’s alignment with the most important technological shifts of the decade—AI, electrification, and advanced communications—makes it a compelling story. Investors should watch the integration of the CommScope assets closely, as successful execution there could propel the stock to even greater heights.


    This content is intended for informational purposes only and is not financial advice. Today's date is 1/28/2026.

  • The Analog Architect: Why 2026 is the “Harvest Year” for Texas Instruments

    The Analog Architect: Why 2026 is the “Harvest Year” for Texas Instruments

    As the global semiconductor industry enters a new era of domestic resilience and advanced manufacturing, few companies stand at a more significant crossroads than Texas Instruments Incorporated (NASDAQ: TXN). Long considered the "blue chip" of the analog world, TI has spent the last five years executing one of the most aggressive capital expenditure programs in its 96-year history. Today, as we look at the landscape in early 2026, the company is finally shifting from a period of heavy investment to what analysts are calling the "Harvest Year." With a massive shift toward 300mm wafer production and a strategic pivot to industrial and automotive markets, TI is attempting to prove that its "own-your-own-factory" model is the ultimate competitive moat in a volatile geopolitical climate.

    Historical Background

    The story of Texas Instruments is effectively the story of the modern electronics industry. Founded in 1930 as Geophysical Service Inc. (GSI), the company initially specialized in reflection seismology to help the oil industry locate deposits. It wasn't until the early 1950s that the company pivoted toward the fledgling semiconductor field.

    The year 1954 marked a tectonic shift when Gordon Teal, a TI scientist, developed the first commercially viable silicon transistor. Just four years later, in 1958, Jack Kilby changed the world forever by inventing the integrated circuit (IC) in a TI laboratory—an achievement that would eventually earn him the Nobel Prize in Physics. Throughout the 1970s and 80s, TI became a household name through consumer electronics, most notably the first hand-held calculator and the iconic Speak & Spell educational toy, which pioneered digital signal processing (DSP) for speech synthesis.

    However, the modern Texas Instruments was born in the 1990s and 2000s through a series of ruthless strategic pivots. Under the leadership of Tom Engibous, TI divested its massive defense division to Raytheon in 1997 to focus entirely on DSPs and analog chips. The 2011 acquisition of National Semiconductor for $6.5 billion solidified its dominance, transforming TI into the world’s largest analog chipmaker—a title it has defended for over a decade.

    Business Model

    Texas Instruments operates with a deceptively simple business model: design, manufacture, and sell thousands of variations of analog and embedded processing chips. Analog chips are the unsung heroes of electronics; they convert real-world signals like temperature, pressure, and sound into digital data. Because these chips are rarely cutting-edge (often built on "mature nodes"), they have remarkably long lifecycles—sometimes lasting 20 to 30 years in industrial or automotive applications.

    TI’s competitive advantage stems from its scale and its manufacturing strategy. The company serves over 100,000 customers across diverse end-markets. Unlike many "fab-less" competitors who outsource production to foundries like TSMC, TI owns and operates the majority of its manufacturing facilities. By 2030, TI aims to produce 95% of its wafers internally. This vertical integration allows for superior control over supply chains and, crucially, significant cost advantages through the use of 300mm wafers, which yield 40% more chips per wafer than the industry-standard 200mm.

    Stock Performance Overview

    Over the last decade, Texas Instruments has been a paragon of reliability, delivering a total return of approximately 400% through the start of 2026. However, the path has not been linear. From 2021 through late 2024, the stock largely traded sideways, caught between the tailwinds of the post-pandemic chip shortage and the headwinds of a massive $60 billion capital expenditure (CapEx) plan.

    In 2025, the stock began to break out of its multi-year range, driven by a recovery in the data center segment and a stabilization of the industrial sector. Over the past 12 months, TXN has climbed approximately 14%, significantly outperforming its 5-year annualized return as investors began to price in the "CapEx reset" of 2026. While it has lagged high-flying AI names like NVIDIA (NASDAQ: NVDA), TI has remained a favorite for defensive growth and dividend-oriented portfolios.

    Financial Performance

    The Q4 2025 earnings report, released yesterday (January 27, 2026), provided the definitive evidence that the cyclical downturn is over. TI reported full-year 2025 revenue of $17.68 billion, a 13% increase over 2024. More importantly, Free Cash Flow (FCF) nearly doubled to $2.94 billion.

    The standout metric in the latest report was the guidance for Q1 2026. For the first time in 15 years, Texas Instruments has guided for sequential revenue growth in the first quarter—a period that is traditionally seasonally weak. With a revenue midpoint of $4.5 billion for Q1, the company is signaling that the inventory gluts in the automotive and industrial sectors have finally cleared. Gross margins, while slightly depressed at 56% due to the costs of bringing new fabs online, are expected to expand throughout 2026 as factory utilization rates rise.

    Leadership and Management

    Haviv Ilan, who took over as CEO in 2023, has brought a focused, "manufacturing-first" mentality to the corner office. A TI veteran of over 20 years, Ilan’s strategy is built on the foundation laid by his predecessor, Rich Templeton. His primary focus is increasing Free Cash Flow per share over the long term.

    Ilan’s leadership has been defined by his commitment to the "300mm Advantage" and a unique approach to inventory. While many semiconductor CEOs aim for "just-in-time" manufacturing, Ilan has treated inventory as a strategic weapon, building up stocks of long-lived chips to ensure TI can win market share the next time a supply shock hits the industry. This strategy was criticized during the 2024 downturn but is being hailed as visionary in 2026 as demand begins to outstrip supply in key industrial niches.

    Products, Services, and Innovations

    TI’s product catalog is a sprawling library of over 80,000 parts. The core of the business remains Analog, which accounts for roughly 75% of revenue. These products include power management chips, signal chain components, and high-voltage isolation products essential for electric vehicles (EVs).

    The recent innovation focus has been on "Embedded Processing," where TI is attempting to regain ground in microcontrollers (MCUs) used in smart factories and automotive safety systems. The company’s R&D efforts are heavily weighted toward power density—fitting more power management capabilities into smaller, more efficient packages. Furthermore, TI continues to leverage its proprietary Digital Light Processing (DLP) technology, which remains a standard in cinema projection and is now finding new life in augmented reality (AR) displays and automotive head-up displays (HUDs).

    Competitive Landscape

    The analog market is a battle of giants, with TI facing off against Analog Devices (NASDAQ: ADI) and NXP Semiconductors (NASDAQ: NXPI). In 2026, a clear divergence in strategy has emerged.

    Analog Devices has pursued a "fab-light" model, outsourcing more of its production to stay lean. This allowed ADI to maintain higher margins during the 2024 downturn. However, TI is now using its lower-cost internal 300mm capacity to compete on price. In early 2026, ADI announced a 15% price hike across several product lines; in contrast, TI has kept pricing relatively flat, aiming to undercut competitors and capture market share in high-volume industrial applications. Meanwhile, NXP remains the leader in automotive logic, but TI is aggressively encroaching on that territory with its new GaN (Gallium Nitride) power chips for EV fast-charging.

    Industry and Market Trends

    The semiconductor industry in 2026 is defined by three macro drivers: the electrification of everything, the automation of the factory floor (Industry 4.0), and the expansion of the "Edge" in AI.

    TI is uniquely positioned to benefit from the "Edge AI" trend. While large language models require massive GPUs in data centers, the devices that interact with the physical world (sensors, motors, medical devices) require the analog and embedded chips that TI specializes in. Furthermore, the shift from 400V to 800V battery architectures in EVs has created a massive replacement cycle for power management semiconductors, a trend that TI has capitalized on with its latest Sherman, Texas fab production.

    Risks and Challenges

    Despite the optimistic outlook for 2026, TI faces significant risks:

    1. Utilization Headwinds: If the global economy slows, TI’s massive new fabs will sit underutilized. Because of TI’s high fixed costs, low utilization can lead to rapid margin compression.
    2. China Competition: Domestic Chinese analog firms like Silergy and SG Micro are moving up the value chain. While they cannot yet match TI’s reliability in high-voltage automotive chips, they are increasingly competitive in low-end consumer and industrial analog parts.
    3. Concentration Risk: With 75% of revenue coming from Industrial and Automotive, TI is highly sensitive to the global manufacturing PMI and the pace of EV adoption.

    Opportunities and Catalysts

    The primary catalyst for TI in 2026 is the reduction in Capital Expenditure. After spending roughly $5 billion per year on fab construction, the company is projected to drop its CapEx to the $2B–$3B range this year. This "CapEx cliff" will result in a massive surge in Free Cash Flow, much of which is expected to be returned to shareholders through aggressive buybacks and another double-digit dividend increase.

    Furthermore, the full integration of the Lehi, Utah (LFAB2) facility in mid-2026 will provide TI with unprecedented capacity for embedded processing chips, potentially allowing the company to reclaim market share it lost during the 2021-2022 shortage.

    Investor Sentiment and Analyst Coverage

    Wall Street sentiment toward TXN is currently "cautiously bullish." As of January 2026, approximately 60% of analysts have a "Buy" or "Outperform" rating, up from 40% a year ago. Institutional investors, including Vanguard and BlackRock, have maintained their core positions, viewing TI as a essential "infrastructure play" for the digitized economy. Retail sentiment, often found on platforms like Reddit's r/stocks, remains focused on TI’s 20-year dividend growth streak, viewing it as a safe haven in a market that has become increasingly speculative around AI.

    Regulatory, Policy, and Geopolitical Factors

    Texas Instruments is a major beneficiary of the U.S. CHIPS and Science Act. In 2025 and 2026, the company is realizing significant benefits from the 25% to 35% Investment Tax Credits (ITC) for its Sherman and Lehi facilities. This government support has effectively subsidized TI’s transition to 300mm, making it one of the most cost-efficient producers in the world.

    However, the geopolitical tension between the U.S. and China remains a double-edged sword. While U.S. policy encourages domestic manufacturing (benefiting TI), potential Chinese retaliation or "buy local" mandates for Chinese state-owned enterprises could threaten TI's significant revenue base within the mainland.

    Conclusion

    As we move through 2026, Texas Instruments appears to be entering a "Golden Age" of cash generation. The $60 billion investment cycle that weighed on the stock for years is finally bearing fruit in the form of lower production costs and superior supply chain reliability. While the analog market remains cyclical and competition from China is intensifying, TI's decision to own its manufacturing at a massive scale has created a formidable barrier to entry.

    For the long-term investor, the thesis for TXN is simple: it is a bet on the increasing "silicon content" of the physical world. Whether it is an electric truck, a robotic arm, or a smart thermostat, it likely contains a Texas Instruments chip. With the "Harvest Year" now underway, the company is well-positioned to reward patient shareholders with both capital appreciation and growing income.


    This content is intended for informational purposes only and is not financial advice.

  • General Motors in 2026: The High-Stakes Transformation of an American Icon

    General Motors in 2026: The High-Stakes Transformation of an American Icon

    Date: January 28, 2026

    Introduction

    As of early 2026, General Motors Company (NYSE: GM) stands at a defining crossroads in its 118-year history. Once viewed as a slow-moving legacy giant, GM has spent the last 24 months executing a rigorous "capital-first" strategy that has fundamentally shifted its market perception. While the broader automotive industry has struggled with a cooling electric vehicle (EV) market and high interest rates, GM recently shocked Wall Street by hitting all-time stock highs of $87.00 following its full-year 2025 earnings report. By "clearing the decks" through massive non-cash write-downs and doubling down on its profitable internal combustion engine (ICE) trucks and SUVs, GM has reclaimed its title as a blue-chip powerhouse, proving that the transition to a high-tech future does not have to come at the expense of current-day profitability.

    Historical Background

    Founded in 1908 by William C. Durant, General Motors was built as a holding company for various brands including Buick, Oldsmobile, and Cadillac. Under the legendary leadership of Alfred P. Sloan in the 1920s, GM pioneered the concept of "a car for every purse and purpose," establishing a ladder of brands that allowed consumers to trade up as they gained wealth. This model made GM the world’s largest automaker for 77 years (1931–2008).

    However, structural inefficiencies, legacy labor costs, and the 2008 financial crisis led to a government-backed Chapter 11 bankruptcy in 2009. The "New GM" that emerged was leaner and more focused. Under Mary Barra, who became the first female CEO of a major global automaker in 2014, the company moved away from global volume for volume's sake—exiting the European market by selling Opel/Vauxhall in 2017—to focus on its high-margin North American core and future-facing technologies like autonomous driving and electrification.

    Business Model

    GM operates a multifaceted business model centered on four primary segments:

    1. GM North America (GMNA): The company’s primary engine of profit, driven by the Chevrolet Silverado and GMC Sierra pickups, and the Cadillac Escalade.
    2. GM International (GMI): Focused largely on the Chinese market and South America. In China, GM operates through joint ventures with SAIC and Wuling.
    3. GM Financial: A captive finance arm that provides retail lending, leasing, and commercial dealer financing, which consistently contributes roughly $2 billion to $3 billion in annual earnings.
    4. Software and Services: A growing segment focused on "Software Defined Vehicles" (SDVs) and subscription-based revenue through services like Super Cruise and OnStar.

    The company has transitioned its manufacturing philosophy to the "Ultium" (now evolving into a more flexible battery strategy) platform, designed to underpin a wide range of EV models using common components to achieve economies of scale.

    Stock Performance Overview

    The stock performance of General Motors has been a story of resilience and late-cycle acceleration.

    • 1-Year Performance: In 2025, GM was a standout performer, surging nearly 50%. This rally was fueled by aggressive share buybacks and a market that rewarded GM's pivot from "EV at any cost" to "EV at the right cost."
    • 5-Year Performance: Over the last five years, GM has outperformed many of its legacy peers, including Ford Motor Company (NYSE: F), as it maintained higher margins and executed more disciplined capital allocation.
    • 10-Year Performance: On a decade-long horizon, GM’s returns were historically capped by the massive R&D spend required for the EV transition. However, the late-2024 to early-2026 period has seen the stock finally break out of its long-standing $30–$50 range.

    Financial Performance

    In its latest earnings report (Q4 2025), released on January 27, 2026, GM posted a complex but ultimately bullish set of numbers:

    • Net Income: Full-year 2025 net income was $2.7 billion. While this was down from 2024, the figure was heavily impacted by a $7.2 billion non-cash charge in Q4 2025, used to write down unused EV manufacturing equipment and reorganize the Cruise autonomous division.
    • EBIT-Adjusted: Removing the one-time charges, GM’s adjusted EBIT was a robust $12.7 billion.
    • Earnings Per Share (EPS): Q4 adjusted EPS of $2.51 beat analyst estimates of $2.28.
    • Valuation: Despite the stock rally, GM still trades at a relatively conservative forward P/E ratio compared to tech rivals, as the market weighs the long-term capital intensity of the auto sector.
    • Shareholder Returns: GM authorized a new $6 billion share repurchase program for 2026 and raised its dividend by 20% to $0.18 per share.

    Leadership and Management

    Mary Barra remains at the helm as Chair and CEO, having navigated the company through the most tumultuous decade in automotive history. Her leadership is characterized by "ruthless prioritization." In 2025, she made the difficult decision to pull back on the "all-in by 2035" EV pledge, introducing more plug-in hybrids (PHEVs) to meet consumer demand—a move that was initially criticized by ESG purists but lauded by investors for protecting the balance sheet.

    The management team, including CFO Paul Jacobson, has gained significant credibility for its transparency regarding capital allocation and its success in reducing the company's outstanding share count by over 25% since late 2023.

    Products, Services, and Innovations

    Innovation at GM is currently focused on three pillars:

    1. Flexible Electrification: Moving beyond the "Ultium" branding, GM is now integrating Lithium Iron Phosphate (LFP) battery technology to lower the entry price of EVs like the Chevrolet Equinox EV.
    2. Super Cruise: GM’s hands-free driving technology is widely considered the industry benchmark for safety and reliability. Subscriber numbers reached 620,000 in late 2025.
    3. BrightDrop: The commercial EV van business has been fully integrated into Chevrolet, streamlining operations and focusing on large-scale fleet customers like FedEx and Walmart.

    Competitive Landscape

    GM faces a three-front war in 2026:

    • The Domestic Rivals: Ford Motor Company (NYSE: F) continues to struggle with high warranty costs and slower EV adoption, allowing GM to maintain a superior margin profile.
    • The Tech Incumbent: Tesla (NASDAQ: TSLA) remains the volume leader in BEVs, but as its lineup ages, GM’s fresh portfolio of trucks and luxury Cadillacs is chipping away at Tesla’s high-end market share.
    • The Global Giant: BYD (OTC: BYDDF), the Chinese EV leader, represents the most significant long-term threat. While BYD is currently hampered by US tariffs, its mastery of the low-cost LFP supply chain keeps GM under constant pressure to innovate on cost.

    Industry and Market Trends

    The "EV Winter" of 2024–2025 led to a massive industry shift. Consumers have shown a preference for hybrid drivetrains over pure battery electric vehicles due to charging anxiety and price. GM’s late-2024 pivot to re-introduce hybrids into the North American market has proven prescient. Additionally, the industry is seeing a trend of "Software-Defined Vehicles," where manufacturers look to unlock recurring revenue through feature-on-demand subscriptions (e.g., heated seats or performance upgrades).

    Risks and Challenges

    • Labor Costs: The 2023 UAW contract significantly increased GM’s cost per vehicle. Any future labor unrest could severely impact North American margins.
    • China Exposure: GM’s profits from its China joint ventures have declined as local brands like BYD and Xiaomi gain dominance.
    • Technology Execution: The pivot of Cruise from robotaxis to personal autonomy is still in its early stages. Any safety failures in its Super Cruise or Ultra Cruise systems would be a massive reputational blow.

    Opportunities and Catalysts

    • LFP Battery Implementation: The shift to LFP cells in 2026/2027 is expected to reduce EV costs by up to $4,000 per vehicle, potentially making the EV segment profitable on a standalone basis.
    • Capital Allocation: With a $6 billion buyback authorized, the reduction in share count will likely continue to provide a tailwind for EPS growth even if top-line revenue remains flat.
    • Fleet Electrification: As companies move toward ESG targets, GM’s strong position in the commercial van and truck market provides a steady growth lever.

    Investor Sentiment and Analyst Coverage

    Wall Street sentiment on GM has shifted from "Hold" to "Strong Buy" throughout 2025. Analysts at major firms like Goldman Sachs and Morgan Stanley have praised GM’s "pragmatic approach" to electrification. Institutional ownership remains high, and the company has successfully attracted "Value" investors who are drawn to the dividend growth and the aggressive share repurchase strategy.

    Regulatory, Policy, and Geopolitical Factors

    GM is heavily influenced by the Inflation Reduction Act (IRA), which provides significant tax credits for domestic battery production. However, geopolitical tensions with China remain a risk, particularly regarding the supply chain for rare earth minerals used in motors. Furthermore, tightening EPA emissions standards through 2030 continue to mandate a gradual shift away from ICE vehicles, regardless of current consumer preference.

    Conclusion

    General Motors in 2026 is no longer just a "car company"—it is a disciplined capital-allocation machine. By acknowledging the limitations of the current EV market and focusing on its core strengths in trucks and software, the company has managed to achieve record stock prices while simultaneously restructuring for the future. For investors, GM offers a unique combination of "Value" (low P/E, high buybacks) and "Growth" (software and EV upside). The key metric to watch moving into mid-2026 will be the margin recovery in the North American segment as the $7.2 billion in 2025 write-downs begins to reflect a leaner, more efficient operation.


    Disclaimer: This content is intended for informational purposes only and is not financial advice. Investing in the stock market involves risk.

  • Steeled for Transition: A Deep-Dive Analysis of Steel Dynamics (STLD)

    Steeled for Transition: A Deep-Dive Analysis of Steel Dynamics (STLD)

    Introduction

    As of January 27, 2026, the industrial landscape in the United States stands at a crossroads of infrastructure renewal and decarbonization. At the center of this transformation is Steel Dynamics, Inc. (NASDAQ: STLD), one of the nation’s largest and most efficient domestic steel producers. Historically celebrated for its nimble Electric Arc Furnace (EAF) model, STLD is currently capturing investor attention not just for its core steel business, but for its ambitious pivot into the aluminum market. Despite a 2025 fiscal year characterized by "metal spread" compression—where the gap between finished steel prices and raw material scrap costs narrowed—STLD has demonstrated remarkable resilience. With a market capitalization of approximately $26.5 billion and a recent earnings beat that sent shares to record highs, the company is proving that its diversified, circular manufacturing model can thrive even as traditional market cycles soften.

    Historical Background

    Steel Dynamics was born from a vision of disruptive efficiency. Founded in 1993 by three alumni of Nucor Corporation—Keith Busse, Mark Millett, and Richard Teets—the company was designed to leverage the "mini-mill" revolution. Unlike traditional integrated steelmakers that rely on massive, carbon-intensive blast furnaces and iron ore, STLD focused exclusively on EAF technology, which melts recycled scrap metal using electricity.

    The company’s journey from a greenfield startup in Butler, Indiana (1996), to a Fortune 500 leader is a study in disciplined growth. Key milestones include the 2007 acquisition of OmniSource, which secured a steady supply of scrap metal, and the 2014 purchase of Severstal Columbus, which expanded its footprint into the high-growth Southeastern U.S. market. Most recently, the 2022 commissioning of its state-of-the-art flat-roll mill in Sinton, Texas, and the 2025 launch of its aluminum division, have solidified its reputation as a pioneer in diversified metal production.

    Business Model

    STLD operates a vertically integrated circular manufacturing model that is unique in its breadth. The business is organized into four primary reporting segments:

    1. Steel Operations: This is the flagship segment, generating approximately 62% of revenue. It produces a wide array of products including hot-rolled, cold-rolled, and coated steel, as well as structural beams and rails.
    2. Metals Recycling (OmniSource): Accounting for roughly 21% of revenue, this segment processes and sells ferrous and nonferrous scrap. It serves as a vital internal supply chain for STLD’s mills, hedging against external scrap price volatility.
    3. Steel Fabrication (New Millennium Building Systems): Contributing 9% of revenue, this division produces steel joists and girders for non-residential construction. It acts as a "natural hedge"—when steel prices fall, the fabrication margins often expand as their input costs drop.
    4. Aluminum (Emerging): The newest pillar, focused on recycled aluminum flat-rolled products for the beverage packaging, automotive, and industrial sectors.

    Stock Performance Overview

    Investors who have held STLD over the long term have been handsomely rewarded. As of late January 2026, the stock’s performance metrics are staggering:

    • 1-Year Performance: Up approximately 50%, fueled by the successful ramp-up of the Sinton mill and optimism surrounding the aluminum expansion.
    • 5-Year Performance: A total return of over 410%, significantly outperforming the S&P 500 and most industrial peers.
    • 10-Year Performance: An explosive 1,294% total return, reflecting the company’s transition from a regional player to a national powerhouse.

    Since its 1996 IPO, STLD has maintained a compound annual growth rate (CAGR) of 15.26%, a testament to its consistent profitability and shareholder-friendly capital allocation.

    Financial Performance

    Steel Dynamics’ 2025 full-year results, released earlier this month, highlight the company’s ability to navigate a challenging macro environment.

    • Revenue: $18.2 billion, a 3.6% increase year-over-year.
    • Net Income: $1.2 billion, or $7.99 per diluted share.
    • Operating Margins: While margins faced pressure due to softening steel prices ($1,089/ton average in 2025 vs. higher levels in 2024), the company maintained an industry-leading ROIC (Return on Invested Capital).
    • Liquidity and Debt: The company ended 2025 with over $2.2 billion in liquidity and generated $1.4 billion in cash flow from operations.
    • Valuation: Despite the stock being at all-time highs, it continues to trade at a reasonable P/E ratio, as earnings growth has kept pace with price appreciation.

    Leadership and Management

    The company remains under the steady hand of co-founder Mark Millett, who serves as Chairman and CEO. Millett is widely regarded as one of the most effective leaders in the materials sector, known for his focus on a "high-performance" culture and a decentralized management style.

    The leadership's strategy is currently focused on "Value-Add" diversification. Rather than competing solely on volume in commodity steel, STLD is pushing into higher-margin products like painted and coated steels and, most notably, recycled aluminum. This move is intended to reduce the company's sensitivity to the steel price cycle and tap into the growing demand for sustainable packaging and lightweight automotive materials.

    Products, Services, and Innovations

    Innovation at STLD is synonymous with sustainability and automation. The Sinton, Texas mill is a prime example, utilizing advanced digital monitoring to optimize energy consumption and yield.
    In the product sphere, the company has become a leader in "Green Steel." In July 2025, all of its steel mills received certification from the Global Steel Climate Council (GSCC). By using EAF technology, STLD’s carbon intensity is roughly 75% lower than the global average for blast furnace production.

    The company's R&D efforts are currently concentrated on its $2.5 billion aluminum rolling mill. By applying its scrap-based EAF expertise to aluminum, STLD aims to disrupt a market that has historically been dominated by less flexible, higher-emission production methods.

    Competitive Landscape

    STLD operates in a highly competitive, yet increasingly consolidated, North American market. Its primary rivals include:

    • Nucor (NUE): The largest U.S. steelmaker and a fellow EAF operator. Nucor has greater scale, but STLD often boasts higher operating margins and a more focused growth profile.
    • Cleveland-Cliffs (CLF): An integrated producer with significant control over its iron ore supply. Cliffs has a stronghold on the automotive sector but faces higher fixed costs than STLD.
    • United States Steel (X): Following its recent strategic shifts and ownership changes, U.S. Steel is transitioning toward the "Big River" EAF model to compete directly with STLD’s efficiency.

    STLD’s competitive edge lies in its lowest-quartile cost structure and its high degree of vertical integration through OmniSource.

    Industry and Market Trends

    Three major trends are currently shaping the industry in 2026:

    1. Onshoring and Infrastructure: The Infrastructure Investment and Jobs Act (IIJA) continues to drive demand for structural steel in bridges and transit. Simultaneously, the "onshoring" of manufacturing is boosting demand for industrial warehouses and data centers.
    2. The Energy Transition: Solar farms and wind turbines require significant amounts of steel. STLD’s specialized products are increasingly feeding into these renewable energy supply chains.
    3. Decarbonization: As OEMs (Original Equipment Manufacturers) look to reduce their Scope 3 emissions, they are willing to pay a premium for "low-carbon" steel and aluminum, placing STLD in a favorable pricing position.

    Risks and Challenges

    Despite its strengths, STLD is not immune to risks:

    • Margin Compression: In 2025, the "metal spread" narrowed as Hot Rolled Coil (HRC) prices softened while scrap costs remained stubbornly high. If scrap prices continue to rise due to global demand for recycled materials, STLD's margins could face further headwinds.
    • Cyclicality: A significant portion of STLD’s revenue is tied to non-residential construction. A broader economic recession or high interest rates slowing down commercial building projects could hurt the Fabrication and Steel segments.
    • Execution Risk: The ramp-up of the aluminum mill is a multi-billion dollar bet. While the segment turned EBITDA-positive in December 2025, reaching the targeted $650M–$700M annual run rate is not guaranteed.

    Opportunities and Catalysts

    The primary catalyst for 2026 is the Aluminum Segment. Management expects to reach 90% utilization by late 2026. This would transform STLD into a "multi-metal" company, diversifying its earnings base and potentially leading to a "valuation re-rating" as it begins to be compared with aluminum specialists like Ball Corp or Novelis.

    Furthermore, the ongoing ramp-up of the Sinton mill to its full capacity offers another lever for volume growth. Management has also hinted at continued aggressive share repurchases, having bought back 4% of outstanding shares in 2025 alone.

    Investor Sentiment and Analyst Coverage

    Wall Street remains cautiously optimistic. Following the Q4 2025 earnings beat, the consensus rating is a "Moderate Buy." Analysts from firms like Morgan Stanley and Goldman Sachs have raised their price targets, with some reaching as high as $194.
    Institutional ownership is high at 82%, with major firms like Vanguard and BlackRock holding significant positions. The sentiment among retail investors is also positive, often citing STLD as a "best-in-class" operator with a fortress balance sheet.

    Regulatory, Policy, and Geopolitical Factors

    The regulatory environment is a tailwind for STLD. Current trade policies, including Section 232 tariffs, continue to protect domestic producers from unfairly traded foreign imports. Furthermore, the 2026 landscape is heavily influenced by the "Buy America" provisions in federal infrastructure projects, which mandate the use of domestic steel.

    Geopolitically, the shift away from Russian and Chinese steel due to environmental and trade concerns has allowed U.S.-based EAF producers to capture more market share.

    Conclusion

    Steel Dynamics (NASDAQ: STLD) enters 2026 as a premier industrial play on the American economy. While the softening of steel prices and the rise in scrap costs presented a margin challenge in the past year, the company’s diversified business model and variable cost structure have allowed it to remain highly profitable.

    Investors should closely monitor the aluminum mill's progress and the stability of non-residential construction demand. With a visionary management team, a leader’s position in green steel, and a significant new growth engine in aluminum, Steel Dynamics remains a compelling case for those looking to invest in the backbone of modern infrastructure. As the company transitions from a "steel company" to a "metals solutions provider," its journey is far from over.


    This content is intended for informational purposes only and is not financial advice.