Tag: Retail Sector

  • Target’s Bullseye Under Fire: Analyzing Today’s 7% Slide and the Retailer’s Identity Crisis

    Target’s Bullseye Under Fire: Analyzing Today’s 7% Slide and the Retailer’s Identity Crisis

    Today’s date is March 24, 2026.

    Introduction

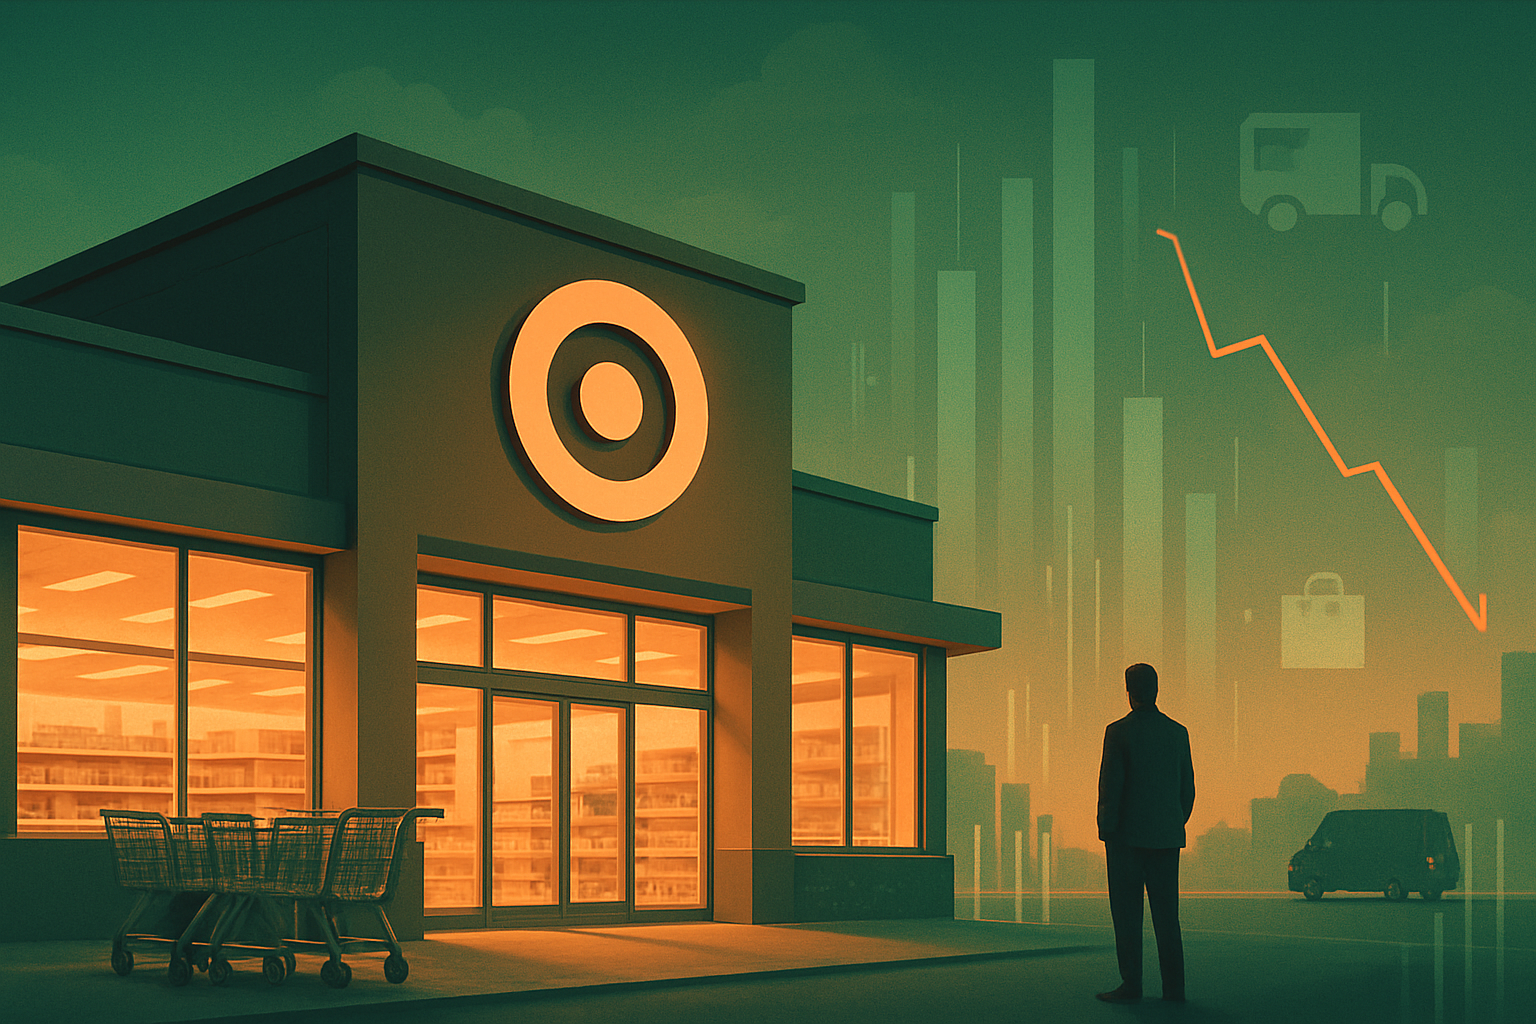
    The "Target Effect"—that inexplicable retail magic where a consumer enters for a gallon of milk and leaves with a $200 cart of home décor and seasonal apparel—appears to be losing its spell. On Tuesday, shares of Target Corporation (NYSE: TGT) plummeted 7.0%, a sharp correction that wiped billions from the retailer's market capitalization. The catalyst was a disheartening preliminary Q1 update that signaled a deeper-than-expected contraction in discretionary spending and an persistent struggle with operating margins.

    For years, Target has been the darling of the "middle-class splurge," successfully positioning itself between the rock-bottom pricing of discount giants and the premium experience of specialty boutiques. However, today’s sell-off suggests that the "cheap chic" pioneer is facing a structural identity crisis in a 2026 economic landscape defined by cautious consumers and fierce digital competition. As new CEO Michael Fiddelke marks his first major quarterly update since taking the helm in February, the market is asking a difficult question: Can Target still win in an era where "value" is no longer just about style, but survival?

    Historical Background

    Target’s journey began in 1902 when George Draper Dayton founded Goodfellow Dry Goods in Minneapolis. After several name changes, it became The Dayton Company, a premier department store operator. However, the true transformation occurred in 1962—the same year Walmart and Kmart were born—when the company launched the first Target store in Roseville, Minnesota. The goal was to create a "discount" store that didn't feel like one.

    By the 1990s, Target had perfected its "Expect More. Pay Less." slogan, focusing on design-led partnerships with high-end designers like Isaac Mizrahi and Michael Graves. This strategy allowed Target to differentiate itself from the "sea of sameness" in the discount sector. In 2000, the parent Dayton-Hudson Corporation officially renamed itself Target Corporation, shedding its department store roots to focus entirely on its bullseye-branded growth engine. Despite a disastrous foray into Canada in 2013 and a massive 2014 data breach, the company staged a historic comeback under Brian Cornell, who retired earlier this year, leaving the reins to Fiddelke.

    Business Model

    Target operates as a massive general merchandise retailer with nearly 2,000 stores across the United States. Unlike its primary competitor, Walmart (NYSE: WMT), which derives more than half of its revenue from groceries, Target’s business model is heavily tilted toward discretionary categories: apparel, home furnishings, and beauty.

    Key pillars of their model include:

    • Owned Brands: Target manages a portfolio of more than 45 private labels, such as Good & Gather and All in Motion, which generate over $30 billion in annual sales. These brands offer higher margins than national brands and serve as a primary loyalty driver.
    • Stores-as-Hubs: Target fulfills roughly 96% of its total sales—including digital orders—directly from its physical stores. This logistical strategy minimizes last-mile costs and powers its highly successful "Drive Up" curbside service.
    • Shop-in-Shop: To increase foot traffic, Target has integrated "mini-stores" from partners like Ulta Beauty (NASDAQ: ULTA), Starbucks (NASDAQ: SBUX), and Apple (NASDAQ: AAPL) within its aisles.

    Stock Performance Overview

    The last decade has been a rollercoaster for TGT shareholders. After the 2020-2021 pandemic boom, which saw the stock surge to an all-time high of approximately $268, the company spent 2023 and 2024 in a painful "recalibration" phase.

    • 1-Year Performance: Before today's drop, Target had been staging a modest recovery, up 12% year-over-year as investors hoped for a discretionary spending rebound.
    • 5-Year Performance: TGT has largely underperformed the broader S&P 500, as the company grappled with inventory gluts in 2022 and rising operational costs in 2025.
    • 10-Year Performance: Despite recent volatility, long-term investors have seen respectable gains, though the stock has lagged behind Amazon (NASDAQ: AMZN) and Costco (NASDAQ: COST) by significant margins over the same period.

    Financial Performance

    The data released today for the preliminary Q1 2026 update was the primary driver of the 7% sell-off. Target reported that comparable store sales (comps) fell 1.8% year-over-year, missing analyst estimates of a 0.5% gain.

    • Revenue & Margins: Total revenue grew slightly due to new store openings, but gross margins contracted to 26.5% from 27.2% a year ago. The company cited "markdown pressure" to clear inventory in home and apparel categories.
    • Guidance: Most damaging was the revision of full-year EPS guidance. Target now expects earnings of $8.10–$9.10 per share, down from previous estimates of $9.40.
    • Cash Flow: While free cash flow remains healthy at roughly $4 billion annually, the company’s capital expenditure on its "300-store expansion plan" is eating into the cash available for accelerated share buybacks.

    Leadership and Management

    This morning’s decline is a "baptism by fire" for CEO Michael Fiddelke. Having served as CFO and COO under Brian Cornell, Fiddelke was seen as the "continuity candidate." However, today's market reaction suggests investors are looking for more than just steady hands; they want a visionary shift.

    The board, led by independent directors with deep retail and tech backgrounds, remains supportive of Fiddelke’s operational focus. However, some activists have begun whispering that the management team has been "too defensive" regarding the threat of Walmart’s growing dominance in the grocery and high-income demographic.

    Products, Services, and Innovations

    Target’s competitive edge has always been its ability to turn a mundane chore into an "experience." Recent innovations include:

    • Target Circle 360: The paid membership program, launched in 2024, has reached 15 million members but still trails significantly behind Amazon Prime and Walmart+.
    • AI-Enhanced Inventory: The company has invested heavily in generative AI to predict local demand, yet today’s inventory-driven margin miss suggests these tools are still in their refining stages.
    • Drive Up Returns: Allowing customers to return items without leaving their cars has become a major service differentiator, though it adds to the logistical complexity of the store-hub model.

    Competitive Landscape

    Target is caught in a "pincer movement" between two retail giants:

    • Walmart (WMT): Walmart’s aggressive push into fashion and beauty is directly stealing "Target guests." Furthermore, Walmart’s superior grocery supply chain makes it the preferred destination for consumers battling food inflation.
    • Amazon (AMZN): Amazon’s "Same Day" delivery capabilities have neutralized much of the convenience advantage Target once held with its physical store locations.
    • Costco (COST): For the suburban families that make up Target’s core, Costco is increasingly winning the battle for "bulk" essentials, leaving Target to fight for the "top-off" trips.

    Industry and Market Trends

    Retail in 2026 is grappling with a "bifurcated consumer." High-income households continue to spend on luxury and experiences, while the middle-and-lower income brackets—Target’s bread and butter—are retreating.

    • The "Experience" Shift: Consumers are prioritizing travel and dining over "things," a trend that disproportionately hurts Target’s home and apparel segments.
    • Digital Saturation: E-commerce growth has leveled off, forcing retailers to focus on "omnichannel" efficiency rather than just "clicks."

    Risks and Challenges

    The most pressing risk for Target remains "Retail Shrink." Organized retail crime and theft have significantly impacted the bottom line. Despite closing underperforming stores in high-crime urban centers in 2024 and 2025, the company noted today that theft-related losses are still nearly 100 basis points higher than historical averages.

    Additionally, Target faces discretionary exposure. With 50% of its sales coming from non-essential categories, it is the first to feel the pain of a cooling economy. Any delay in interest rate cuts by the Federal Reserve further pressures the household budgets of Target’s target demographic.

    Opportunities and Catalysts

    Despite today’s gloom, catalysts remain:

    • Small-Format Expansion: Target is opening dozens of smaller-format stores in college towns and dense urban areas where big-box competitors can't fit.
    • Partnership Pipeline: Rumors of a new "shop-in-shop" partnership with a leading home-improvement or wellness brand could re-energize foot traffic in late 2026.
    • Private Label Export: There is long-term potential for Target to wholesale its most popular owned brands (like All in Motion) to international retailers, creating a new high-margin revenue stream.

    Investor Sentiment and Analyst Coverage

    Wall Street's reaction has been swift. Several major banks, including JPMorgan and Goldman Sachs, moved their ratings from "Buy" to "Neutral" following the update. The consensus view is that Target is in a "show-me" period.

    Institutional ownership remains high (over 80%), but hedge funds have been trimming positions in favor of Walmart’s more defensive profile. Retail sentiment on social platforms like Reddit’s r/stocks is overwhelmingly bearish today, with many users citing "high prices" and "messy aisles" as signs of a brand in decline.

    Regulatory, Policy, and Geopolitical Factors

    Target is navigating a tightening regulatory environment:

    • Labor Laws: Ongoing debates over a federal minimum wage increase and unionization efforts at several Minnesota locations pose a risk to SG&A expenses.
    • Trade Policy: With a significant portion of its apparel and home goods sourced from Southeast Asia and China, any shift in tariff policy under the current administration could immediately impact gross margins.

    Conclusion

    Target’s 7% drop on March 24, 2026, is a sobering reminder that "Cheap Chic" is not a bulletproof strategy. While the company’s "stores-as-hubs" model is a logistical masterpiece, it cannot overcome a fundamental shift in consumer demand.

    For investors, Target currently represents a classic "value trap" vs. "value opportunity" debate. The stock is trading at a significant discount to its historical P/E multiple, but until Michael Fiddelke can prove that Target can grow its grocery share and curb the margin-eroding effects of theft and markdowns, the bullseye will likely remain under pressure. Investors should closely watch the official Q1 earnings call in May for specific details on the "Circle 360" membership growth and inventory turnover rates.


    This content is intended for informational purposes only and is not financial advice.

  • The Rebirth of a Retail Giant: A Comprehensive Research Feature on Dollar Tree, Inc. (DLTR) in 2026

    The Rebirth of a Retail Giant: A Comprehensive Research Feature on Dollar Tree, Inc. (DLTR) in 2026

    As of March 20, 2026, the retail landscape has undergone a seismic shift, and few companies embody this transformation more than Dollar Tree, Inc. (NASDAQ: DLTR). Once tethered to a struggling subsidiary and a rigid $1.00 price point, the Chesapeake, Virginia-based retailer has emerged in 2026 as a leaner, multi-price "pure-play" powerhouse. Following the landmark divestiture of the Family Dollar banner in late 2025, Dollar Tree has refocused its identity, successfully courting a higher-income demographic while maintaining its core value proposition. This feature explores the strategic pivot that saved the company from a multi-year slump and what the "New Dollar Tree" means for investors today.

    Historical Background

    The story of Dollar Tree is a classic tale of American retail evolution. Founded in 1986 by K.R. Perry, Doug Perry, and Macon Brock as "Only $1.00," the company initially focused on a simple, fixed-price model that resonated deeply with bargain hunters. By the early 2000s, it had grown into a national chain, eventually acquiring competitors like Deal$ and Dollar Giant.

    However, the most significant inflection point occurred in 2015, when Dollar Tree acquired Family Dollar for $8.5 billion. The merger was intended to create a retail giant capable of rivaling Dollar General (NYSE: DG) and Walmart (NYSE: WMT). Instead, it became a decade-long anchor. While the Dollar Tree banner remained profitable and beloved, the Family Dollar segment struggled with dilapidated stores, supply chain inefficiencies, and intense competition in rural markets. After years of activist pressure and management turnover, the "merger of equals" was officially dismantled in July 2025 when the Family Dollar business was sold to a private equity consortium, allowing Dollar Tree to return to its roots as a high-growth, single-banner entity.

    Business Model

    In 2026, Dollar Tree’s business model is defined by its "Multi-Price 3.0" strategy. For decades, the company’s primary constraint was its $1.00 (later $1.25) price ceiling. Today, the model has shifted to a curated mix of value tiers:

    • The Core ($1.25): Approximately 80-85% of the store assortment remains at the $1.25 price point, preserving the "entry-level" value that drives foot traffic.
    • The Tiers ($3, $5, $7): Known as "Dollar Tree Plus," these sections offer discretionary goods, electronics, and expanded frozen foods that were previously impossible to stock under the old pricing regime.
    • Segment Focus: The company operates over 9,000 stores across the U.S. and Canada, primarily in suburban and urban markets. Unlike its rivals, Dollar Tree leans heavily into "seasonal" and "treasure hunt" inventory, encouraging impulse buys of home décor, party supplies, and stationery.

    Stock Performance Overview

    The last five years have been a volatile journey for DLTR shareholders.

    • 1-Year Performance: Over the past 12 months (March 2025 – March 2026), the stock has rallied approximately 28%. This surge was catalyzed by the formal completion of the Family Dollar sale in July 2025, which unlocked significant shareholder value.
    • 5-Year Performance: On a five-year horizon, the stock shows a cumulative gain of roughly 15%. This reflects a "U-shaped" recovery; the stock peaked near $175 in early 2022, crashed to the $60 range in 2024 amid multi-billion dollar impairment charges, and has since recovered to the $110–$115 range.
    • 10-Year Performance: Long-term investors have seen a total return of approximately 55%, underperforming the broader S&P 500 but outperforming direct peers like Dollar General, which struggled with similar operational headwinds in 2023-2024.

    Financial Performance

    Dollar Tree’s FY2025 results, reported in early 2026, signal a financial renaissance.

    • Revenue and Growth: On a continuing operations basis, net sales rose 10.4% to $19.4 billion in FY2025. Comparable store sales (comps) grew 5.3%, a healthy figure for the discount sector.
    • Margins: Gross margins expanded significantly to 39.1%, up 150 basis points year-over-year. This expansion is directly attributed to the higher-margin "Plus" items and the elimination of the loss-making Family Dollar logistics network.
    • Debt and Cash Flow: Following the sale of Family Dollar for $1.007 billion, the company used the ~$680 million in net proceeds to pay down high-interest debt and fund the rollout of its new Arizona distribution center.
    • Valuation: Trading at approximately 16x forward earnings, DLTR is priced at a premium compared to its 2024 lows but remains attractive relative to its projected 12% EPS growth rate.

    Leadership and Management

    The current leadership team is led by CEO Michael (Mike) Creedon Jr., who took the helm in December 2024 following the retirement of Rick Dreiling. Creedon, formerly the company's COO, is viewed by the market as a pragmatic operator. While Dreiling was the visionary who broke the $1.00 price barrier, Creedon is the architect of the "post-divestiture" era.

    The board, chaired by Edward (Ned) J. Kelly III, has focused on governance reform and capital allocation. The reputation of management has shifted from "embattled" to "disciplined," particularly as the company met or exceeded all quarterly guidance metrics throughout 2025.

    Products, Services, and Innovations

    Innovation at Dollar Tree is focused on "Basket Size Expansion."

    • Chilled and Frozen: The most successful innovation of 2025 was the expansion of the "Multi-Price Frozen" section. By offering frozen proteins and meals at $3 to $5, Dollar Tree has become a viable "fill-in" grocery destination.
    • Private Label Strength: The company has revamped its private label brands (like Home Collection and Cravn) to offer aesthetics that rival higher-end retailers like Target (NYSE: TGT).
    • Digital Integration: While e-commerce remains a small part of the business, the "Buy Online, Pick Up in Store" (BOPIS) program for seasonal items saw 40% growth in late 2025, driving additional foot traffic.

    Competitive Landscape

    The discount retail market in 2026 is a three-way battle for the "Value Consumer."

    • Dollar General (DG): DG remains the dominant force in rural America. However, Dollar Tree’s pivot toward suburban, higher-income "treasure hunters" has allowed it to avoid direct price wars with DG in many regions.
    • Walmart (WMT): Walmart’s aggressive rollbacks and superior delivery network remain the biggest threat. Dollar Tree competes by offering a faster, "15-minute" shopping experience and a $1.25 entry price that Walmart’s larger pack sizes often cannot match.
    • The "Temu Effect": Ultra-low-cost e-commerce players like Temu and Shein have pressured the discretionary side of the business. Dollar Tree has countered this by focusing on heavy, fragile, or immediate-need items (like glassware and party supplies) that are difficult to ship cheaply from overseas.

    Industry and Market Trends

    Three macro trends are currently defining the sector:

    1. The "Trade-Down" Consumer: In 2025, nearly 60% of Dollar Tree’s new customer growth came from households earning over $100,000. These consumers are seeking value on "small luxuries" and household essentials as they navigate a plateauing but high-cost economy.
    2. Consumable Dominance: There is a secular shift toward consumables (food, paper products) over discretionary goods. Dollar Tree has adapted by increasing its shelf space for pantry staples.
    3. The "Convenience Gap": As traditional pharmacies and mid-tier grocers close stores due to high rents and labor costs, Dollar Tree is filling the void in urban neighborhoods.

    Risks and Challenges

    Despite its recovery, Dollar Tree faces several headwinds:

    • Tariff Exposure: With a significant portion of its discretionary inventory sourced globally, any escalation in universal tariffs (a hot topic in 2026 policy circles) could squeeze margins or force unpopular price hikes.
    • Labor Costs: Minimum wage increases in key states continue to pressure store-level EBITDA.
    • Shrink and Security: Retail theft ("shrink") remains a persistent issue, particularly in urban locations. The company has invested in AI-driven checkout monitoring, but the costs of these systems impact short-term profitability.

    Opportunities and Catalysts

    • Real Estate Optimization: With the Family Dollar "distraction" gone, management can focus on opening 600+ new Dollar Tree stores annually, targeting underserved suburban pockets.
    • The $7 Price Point: The continued rollout of the $7 tier provides a massive runway for margin expansion, as it allows for the sale of small appliances and larger household goods.
    • M&A Potential: Now that the balance sheet is cleaner, there is speculation that Dollar Tree could acquire a smaller specialty value player (such as a regional craft or party supply chain) to bolster its discretionary segment.

    Investor Sentiment and Analyst Coverage

    Sentiment toward NASDAQ: DLTR is the most bullish it has been in half a decade. Most Wall Street analysts moved the stock from "Underperform" or "Neutral" to "Buy" following the Q3 2025 earnings call.

    • Institutional Moves: Several large hedge funds re-entered positions in late 2025, viewing DLTR as a "cleaner" story than the multi-banner complexity of the past.
    • Retail Sentiment: On social trading platforms, DLTR is often discussed as a "defensive growth" play—a stock that provides safety during economic downturns but has the "kicker" of the multi-price margin expansion.

    Regulatory, Policy, and Geopolitical Factors

    • SNAP and Welfare Policy: Changes to SNAP (Supplemental Nutrition Assistance Program) work requirements in 2026 have created some volatility in consumable sales. Investors are monitoring state-level "processed food" restrictions that could impact what recipients can buy at discount stores.
    • ESG and Sustainability: The company is under increasing pressure to reduce plastic waste, leading to a new "Eco-Value" initiative aimed at introducing more sustainable private-label packaging by 2027.

    Conclusion

    Dollar Tree’s journey from a rigid, single-price retailer to a diversified value platform in 2026 is a masterclass in corporate evolution. By finally severing ties with the Family Dollar experiment, the company has cleared the path for a more profitable and predictable future. While challenges like tariffs and labor costs remain, the "Dollar Tree 3.0" model—which blends the thrill of the $1.25 hunt with the utility of the $5 grocery run—has successfully future-proofed the brand. For the 2026 investor, DLTR offers a compelling mix of defensive stability and margin-driven growth, provided management can maintain its newfound operational discipline.


    This content is intended for informational purposes only and is not financial advice.

  • Dollar Tree (DLTR) Deep-Dive: The Multi-Price Transformation and Post-Divestiture Outlook

    Dollar Tree (DLTR) Deep-Dive: The Multi-Price Transformation and Post-Divestiture Outlook

    As of March 16, 2026, Dollar Tree, Inc. (NASDAQ: DLTR) stands at a pivotal crossroads in retail history. Long known as the steadfast bastion of the $1.00 price point, the company has spent the last 24 months undergoing a radical metamorphosis. Today, the "Dollar Tree" name is synonymous not with a single price, but with a sophisticated "multi-price" value proposition that has successfully captured a new demographic of middle-to-high-income shoppers. With the recent divestiture of the long-struggling Family Dollar banner in 2025, Dollar Tree has emerged as a leaner, higher-margin "pure play" entity. This feature explores how a company once criticized for stagnant growth and operational mishaps has reinvented itself into one of the most resilient stories in the consumer discretionary sector.

    Historical Background

    Founded in 1986 by Macon Brock, Doug Perry, and K.R. Perry in Norfolk, Virginia, Dollar Tree began as "Only $1.00," a retail concept predicated on extreme value and simplicity. For decades, the company thrived on the discipline of the single-price model, expanding rapidly across North America. A significant turning point occurred in 2015 when Dollar Tree acquired Family Dollar for $8.5 billion, a move intended to challenge industry leader Dollar General (NYSE: DG).

    However, the acquisition proved difficult to integrate. Family Dollar stores were often plagued by underinvestment and logistical hurdles, leading to years of margin dilution. By 2023, activist investors and a new leadership team led by Rick Dreiling initiated a "Portfolio Optimization Review." This led to the closure of nearly 1,000 stores in 2024 and the eventual total divestiture of the Family Dollar brand in mid-2025, returning the company to its core Dollar Tree roots.

    Business Model

    Dollar Tree’s current business model revolves around its "Multi-price 3.0" strategy. Moving away from the rigid $1.00 (and later $1.25) ceiling, the company now offers a curated assortment of goods ranging from $1.50 to $7.00, with select high-value items reaching $10.00.

    Revenue is split between two primary categories:

    • Consumables: Food, health, and beauty products that drive frequent foot traffic.
    • Discretionary: Seasonal décor, party supplies, and toys that offer higher margins.

    By expanding its price ceiling, Dollar Tree has been able to stock "need-based" essentials like frozen proteins and larger-format household chemicals, which were previously impossible to sell at $1.25. This has shifted the customer base; as of early 2026, nearly 60% of new customer growth is derived from households earning over $100,000 annually, seeking value amid persistent inflationary pressures.

    Stock Performance Overview

    The last decade for DLTR has been a tale of two eras. Between 2016 and 2024, the stock largely underperformed the broader S&P 500, weighed down by the "Family Dollar drag" and skepticism over the $1.25 price hike. However, the period from mid-2024 to March 2026 has seen a significant re-rating.

    • 1-Year Performance: The stock has seen a 22% surge following the finalized sale of Family Dollar and the realization of higher margins from the multi-price rollout.
    • 5-Year Performance: After bottoming out during the 2023-2024 restructuring phase, the stock has recovered to trade near its all-time highs, reflecting a more efficient capital structure.
    • 10-Year Performance: Long-term holders have seen modest gains, though much of the "lost decade" of 2015-2023 was reclaimed only recently through the successful execution of the turnaround plan.

    Financial Performance

    In the fiscal year 2025 results reported today, Dollar Tree highlighted its new financial profile as a "continuing operations" entity.

    • Net Sales: $19.4 billion (representing the core Dollar Tree banner).
    • Adjusted EPS: $5.94, surpassing analyst expectations.
    • Same-Store Sales: Increased by 5.3% year-over-year, driven by a higher average ticket size as customers embraced the $3 to $5 price points.
    • Margins: Gross margin expanded to a record 39.1%, aided by a "cleaner" inventory and the absence of the lower-margin Family Dollar revenue stream.
    • Debt & Cash Flow: The company utilized the $1 billion proceeds from the Family Dollar sale to pay down high-interest debt and initiate a $2.5 billion share repurchase program.

    Leadership and Management

    The architecture of this turnaround was designed by Rick Dreiling, the retail veteran who stepped down in late 2024. Today, the company is led by CEO Michael (Mike) Creedon Jr. Previously the COO, Creedon has focused on "operational excellence"—specifically, automating the supply chain and cleaning up store environments. Under his leadership, the management team has improved its governance reputation, moving past the regulatory fines of 2023 and 2024 (such as the $41.7 million DOJ settlement related to warehouse conditions) to become a leader in retail compliance.

    Products, Services, and Innovations

    Innovation at Dollar Tree is currently centered on the "store-within-a-store" concept and logistical automation.

    • Dollar Tree Plus: This section of the store features items above the $1.25 floor. In 2026, this concept has evolved into a seamless multi-price layout across the entire store.
    • Rotacart Technology: A major internal innovation, the Rotacart delivery system has streamlined the unloading of trucks, reducing labor costs by 20% and improving "in-stock" levels for high-demand items.
    • Private Labels: The company has expanded its "exclusive brands," allowing it to maintain value while capturing higher margins than national brands.

    Competitive Landscape

    Dollar Tree operates in a crowded value retail space, yet it occupies a unique niche.

    • Dollar General (DG): While DG focuses on rural markets and "fill-in" grocery trips, Dollar Tree thrives in suburban and urban markets with a "treasure hunt" shopping experience.
    • Five Below (NASDAQ: FIVE): A direct competitor for the teen and discretionary market, though Dollar Tree’s expansion into $5+ price points has created a more direct rivalry.
    • Walmart (NYSE: WMT) & Amazon (NASDAQ: AMZN): Both remain the primary threats for consumables. Dollar Tree competes by offering smaller pack sizes and a more convenient "in-and-out" physical footprint.

    Industry and Market Trends

    The "Trade-Down" effect remains the most significant tailwind for the dollar store sector. As inflation and housing costs squeeze middle-class budgets, the stigma of shopping at value retailers has vanished. Additionally, the retail sector is seeing a shift toward "micro-trips"—where consumers stop for 5–10 minutes to pick up a few items rather than doing a 90-minute weekly grocery shop. Dollar Tree’s footprint is perfectly situated for this trend.

    Risks and Challenges

    Despite its success, DLTR is not without risks:

    1. Shrink (Inventory Theft): Retail theft remains a persistent drain on margins, though 2025 saw a slight stabilization due to new AI-monitored checkout systems.
    2. Execution Risk: Balancing the "dollar store" identity while raising prices to $10 is a delicate branding exercise. If the value perception is lost, customers may return to big-box retailers.
    3. Supply Chain Sensitivity: As a significant importer of goods, Dollar Tree is highly vulnerable to shipping rate volatility and geopolitical tensions in the Pacific.

    Opportunities and Catalysts

    • Grocery Expansion: With the multi-price model, Dollar Tree has only just begun to scratch the surface of refrigerated and frozen foods.
    • E-commerce Integration: A renewed focus on "buy online, pick up in-store" (BOPIS) for party supplies and seasonal goods offers a significant digital growth lever.
    • M&A and Buybacks: With a cleaner balance sheet, the company is well-positioned for opportunistic acquisitions of smaller discount chains or continued aggressive share repurchases.

    Investor Sentiment and Analyst Coverage

    Wall Street has largely shifted from a "Wait and See" approach in 2024 to an "Overweight" consensus in 2026. Institutional investors, including several prominent hedge funds, have increased their positions following the Family Dollar divestiture. The consensus price target currently sits at $152.00, with many analysts highlighting that the company’s P/E ratio is finally beginning to align with its higher-growth "pure play" peers.

    Regulatory, Policy, and Geopolitical Factors

    Dollar Tree remains under the microscope of the FDA and OSHA regarding store safety and sanitation following past lapses. Furthermore, the company’s reliance on overseas manufacturing makes it a primary subject of trade policy discussions. Any significant changes in tariffs on consumer goods would necessitate further price adjustments, testing the elasticity of its customer base.

    Conclusion

    Dollar Tree, Inc. has successfully navigated one of the most complex corporate turnarounds in recent retail history. By shedding the underperforming Family Dollar segment and embracing a multi-price future, the company has transformed its financial profile and widened its market appeal. Investors should watch for the continued success of the multi-price rollout and the company's ability to maintain its newfound high-income demographic. While risks like inventory shrink and geopolitical trade tensions remain, the "new" Dollar Tree is a leaner, more profitable, and more strategic competitor than ever before.


    This content is intended for informational purposes only and is not financial advice. Today’s date: 3/16/2026.

  • The Golden Age of Closeouts: A Deep-Dive Research Feature on Ollie’s Bargain Outlet (OLLI)

    The Golden Age of Closeouts: A Deep-Dive Research Feature on Ollie’s Bargain Outlet (OLLI)

    As the retail landscape undergoes a seismic shift—marked by the decline of legacy big-box chains and the rise of the value-conscious consumer—few companies have positioned themselves as effectively as Ollie’s Bargain Outlet Holdings, Inc. (NASDAQ: OLLI). Today, March 12, 2026, the company reported its fourth-quarter and full-year 2025 financial results, underscoring its status as a premier beneficiary of what industry insiders are calling the "Golden Age of Closeouts." While many traditional retailers struggle with shrinking margins and digital disruption, Ollie’s has doubled down on a stubbornly analog, "treasure hunt" shopping experience that is currently yielding record revenues and aggressive physical expansion.

    Historical Background

    Ollie’s Bargain Outlet traces its roots to 1982 in Harrisburg, Pennsylvania. Founded by Morton Bernstein and Mark Butler, the store began with a simple but radical premise: buying brand-name merchandise that manufacturers couldn't sell and offering it to consumers at "extreme value" prices—often 30% to 70% below department store rates. The company’s early years were defined by the charismatic leadership of Mark Butler, whose caricature still serves as the brand's mascot.

    Following its Initial Public Offering (IPO) in July 2015, Ollie’s transitioned from a regional Northeast player into a national powerhouse. Over the last decade, the company has methodically expanded its footprint across the Mid-Atlantic, South, and Midwest. The passing of Mark Butler in 2019 marked a turning point, but the culture he instilled—a lean, opportunistic, and witty approach to retail—remains the backbone of the organization.

    Business Model

    The Ollie’s business model is a masterclass in opportunistic procurement. Unlike traditional retailers that negotiate long-term contracts with suppliers for specific product lines, Ollie’s operates a "flexible buying model." It specializes in closeouts, overstocks, and salvage merchandise. If a major toy manufacturer overproduces for the holiday season or a gourmet food brand changes its packaging, Ollie’s is there to buy the excess in bulk for pennies on the dollar.

    A key pillar of the model is "Ollie’s Army," a loyalty program that boasts millions of members. This program provides the company with deep data on consumer behavior while driving repeat foot traffic through "Army-only" discounts. Notably, Ollie’s maintains almost zero e-commerce presence. By forcing customers into the "stacks," the company encourages a "treasure hunt" psychology where shoppers feel a sense of urgency to buy unique items before they are gone forever. This model protects margins by eliminating the high shipping and return costs associated with online retail.

    Stock Performance Overview

    Over the long term, OLLI has been a standout "compounder" for growth investors.

    • 10-Year Performance: Since 2016, the stock has gained approximately 426%, significantly outperforming the S&P 500. It has transformed from a small-cap niche player into a mid-cap retail staple.
    • 5-Year Performance: The stock has seen a more tempered return of roughly 20.4% since 2021. This period included the volatility of the post-pandemic "bullwhip effect," where inventory gluts initially helped the company but supply chain costs ate into profits.
    • 1-Year Performance: In the past 12 months, the stock has risen between 6% and 11%. Shares are currently trading in the $103–$109 range. While early 2026 was marked by weather-related headwinds (Winter Storm Fern), the underlying stock remains resilient as investors rotate into defensive, value-oriented equities.

    Financial Performance

    Ollie’s reported a robust set of numbers for Fiscal Year 2025.

    • Revenue: Total net sales reached $2.649 billion, a 16.6% increase over the prior year.
    • Comparable Store Sales: The company posted a healthy 3.6% increase in same-store sales, a metric that indicates organic growth within existing locations.
    • Margins: Gross margins have stabilized in the 40% range, a testament to management's ability to negotiate favorable terms during high-profile retail liquidations.
    • Balance Sheet: Perhaps the most impressive metric is the "fortress" balance sheet. As of today’s report, Ollie’s carries $562.8 million in cash and cash equivalents with zero long-term debt. This liquidity provides the "dry powder" necessary to swoop in on massive inventory buys or real estate opportunities as competitors falter.

    Leadership and Management

    The company recently completed a smooth leadership transition. After six years as CEO, John Swygert moved into the role of Executive Chairman in February 2025. Eric van der Valk, formerly the Chief Operating Officer, took the helm as President and CEO.

    Van der Valk is credited with modernizing the company’s supply chain logistics and enhancing the data analytics behind the "Ollie’s Army" program. Under his leadership, the company has become more disciplined in its seasonal assortments while maintaining the "scrappy" buying spirit. The market has responded favorably to this transition, viewing Van der Valk as a steady hand capable of scaling the business toward its long-term goal of 1,300+ stores.

    Products, Services, and Innovations

    Ollie’s product mix is famously eclectic. While they carry traditional consumer packaged goods (CPG) like detergent and snacks, their competitive edge lies in "hard goods" that other off-price retailers like The TJX Companies, Inc. (NYSE: TJX) or Ross Stores, Inc. (NASDAQ: ROST) often avoid.

    • Flooring and Rugs: Ollie’s is one of the largest closeout retailers of laminate flooring and area rugs.
    • Books and Toys: The company frequently buys entire back-catalogs or overstock from major publishers and toy manufacturers.
    • Home Improvement: From air conditioners to power tools, the "big stuff" provides higher basket sizes and differentiates the store from "dollar" formats.
      Recent "innovations" aren't technological but logistical—developing the ability to process and ship massive "bulk buys" from liquidated competitors like Big Lots and Joann Fabrics more efficiently than ever before.

    Competitive Landscape

    Ollie’s occupies a unique sub-sector within the off-price market. While it competes for consumer dollars with giants like TJX and Ross, its true rivals are often regional liquidation outlets and discount retailers like Five Below, Inc. (NASDAQ: FIVE) or Dollar Tree, Inc. (NASDAQ: DLTR).

    • vs. TJX/Ross: Ollie’s focuses less on apparel (which is roughly 15% of their mix) and more on hardlines. This shields them from the rapid fashion cycles and markdowns that can plague apparel-heavy retailers.
    • vs. Dollar Stores: Ollie’s offers a higher quality of brand-name goods (Procter & Gamble, Hasbro, etc.) at prices that often beat the "dollar" price-point-per-unit, attracting a slightly higher-income demographic seeking value rather than just the lowest absolute price.

    Industry and Market Trends

    The "Trade-Down" effect is the most significant macro driver for Ollie's in 2026. As inflation persists in core categories like housing and insurance, middle-class households are increasingly shopping at extreme-value retailers for household essentials.

    Furthermore, the retail "real estate shuffle" is a massive tailwind. The bankruptcy or downsizing of chains like Big Lots, 99 Cents Only, and Bed Bath & Beyond has created a surplus of "warm-box" retail spaces. These sites are ideal for Ollie’s because they require minimal renovation, allowing for a high Return on Invested Capital (ROIC) on new store openings.

    Risks and Challenges

    Despite its strengths, Ollie’s is not without risks:

    1. Execution Risk: The company plans to open 75 stores in 2026. Rapid expansion can lead to cannibalization of existing stores or supply chain strain.
    2. Supply Consistency: Because Ollie's relies on "closeouts," its inventory is inherently unpredictable. If fewer retailers fail or manufacturers get better at managing inventory, the "deal flow" could dry up.
    3. Macro Sensitivity: While "recession-resistant," a severe downturn that hits the $40k–$55k income demographic could reduce discretionary spending on non-essential "treasure hunt" items like books or gadgets.

    Opportunities and Catalysts

    The primary catalyst for OLLI in 2026 is the Big Lots Market Capture. By acquiring 63 former Big Lots leases, Ollie’s is moving into prime territories with established customer bases that are already conditioned to shop for "value" home goods. Analysts estimate this could lead to a significant boost in market share over the next 24 months.

    Additionally, the company is eyeing westward expansion. With only a handful of stores in the Western U.S., states like Texas, Arizona, and Nevada represent a massive "white space" opportunity for the next decade.

    Investor Sentiment and Analyst Coverage

    Wall Street remains generally bullish on Ollie’s. The consensus rating is a "Moderate Buy," with an average price target of $144, suggesting a potential upside of over 30% from current levels.

    • Institutional Presence: Institutions own over 100% of the float (accounting for reporting lags), signaling strong conviction from names like Vanguard and BlackRock.
    • Retail Sentiment: On social platforms and investment forums, OLLI is often cited as a "defensive growth" play—a way to play the retail sector without the volatility of e-commerce or high-fashion trends.

    Regulatory, Policy, and Geopolitical Factors

    As an importer of various goods, Ollie’s is sensitive to trade policy. Any escalation in tariffs, particularly on goods from Southeast Asia, could pressure margins. However, the company’s flexible model allows it to pivot sourcing more quickly than retailers tied to specific brand lines. Locally, rising minimum wages in key expansion states present a headwind for labor costs, though Ollie's lean staffing model (roughly 20-30 employees per store) helps mitigate this impact.

    Conclusion

    Ollie’s Bargain Outlet enters mid-2026 in a position of enviable strength. By capitalizing on the misfortune of struggling competitors and staying disciplined in its "extreme value" niche, the company has turned a simple liquidation model into a sophisticated, high-margin growth engine.

    Investors should monitor the integration of the new Big Lots locations and the performance of the 75 new stores planned for this year. While the "treasure hunt" model is old-fashioned, in an era of digital fatigue and price sensitivity, it remains a remarkably potent strategy for long-term value creation.


    This content is intended for informational purposes only and is not financial advice.

  • At the Intersection of Sport and Culture: A Deep-Dive on Dick’s Sporting Goods (DKS) Q4 FY2025 Results

    At the Intersection of Sport and Culture: A Deep-Dive on Dick’s Sporting Goods (DKS) Q4 FY2025 Results

    As of March 12, 2026, the retail landscape is witnessing a pivotal transformation led by Dick’s Sporting Goods (NYSE: DKS). Once a traditional "big-box" retailer, the company has repositioned itself as an experiential powerhouse and a consolidator in the athletic footwear space. Today’s release of the Q4 FY2025 earnings report marks a critical juncture for the company, as investors parse the initial results of its massive $2.5 billion acquisition of Foot Locker and the continued rollout of its high-concept "House of Sport" locations. With the stock trading at approximately $195.83, the market is evaluating whether Dick’s can successfully "clean the garage" of its newly acquired inventory while maintaining its status as the premier destination for the American athlete.

    Historical Background

    The story of Dick’s Sporting Goods began in 1948 when 18-year-old Dick Stack opened a small bait-and-tackle shop in Binghamton, New York, using a $300 loan from his grandmother’s cookie jar. The business remained a small regional operation until Dick’s son, Edward Stack, took the reins in 1984. Under Ed Stack’s leadership, the company underwent a meteoric expansion, going public in 2002 and eventually acquiring competitors like Galyan’s and Golf Galaxy.

    A defining moment in the company’s history occurred in 2018, when Ed Stack made the controversial decision to stop selling assault-style rifles and raise the age for firearm purchases following the Parkland shooting. While the move initially sparked a boycott, it fundamentally shifted the brand’s identity toward a "wellness and sport" focus, paving the way for the premium, family-friendly retail environment that defines the company today.

    Business Model

    Dick’s Sporting Goods operates a sophisticated omnichannel business model that bridges the gap between traditional retail and digital entertainment. Its revenue streams are diversified across three primary pillars:

    1. Hardline & Softline Retail: Selling national brands (Nike, Under Armour, Adidas) and high-margin private labels like DSG, VRST, and Calia.
    2. Experiential Hubs: Large-format "House of Sport" stores that feature climbing walls, batting cages, and putting greens, designed to drive foot traffic in an era of e-commerce.
    3. Digital Ecosystem: Includes the GameChanger app (a leader in youth sports scoring and streaming) and the Dick’s Media Network, which monetizes the company's first-party customer data.

    The recent acquisition of Foot Locker has added a significant footwear-only segment to the portfolio, giving DKS unprecedented scale in the "sneakerhead" culture and deepening its strategic relationship with Nike.

    Stock Performance Overview

    Over the last decade, DKS has been a standout performer in the retail sector.

    • 10-Year View: The stock has seen a massive appreciation, significantly outperforming the S&P 500 as it transitioned from a mall-based retailer to a dominant category killer.
    • 5-Year View: Shares surged following the COVID-19 pandemic, as consumer interest in outdoor activities and home fitness spiked. The company used this period to bolster its balance sheet and accelerate store renovations.
    • 1-Year View: The past twelve months have been more volatile. The stock reached highs near $230 in mid-2025 before pulling back following the announcement of the Foot Locker acquisition, as investors weighed the $2.5 billion price tag and integration risks. As of March 2026, the stock is in a recovery phase, buoyed by strong core "comp" (comparable store) sales.

    Financial Performance

    In the Q4 FY2025 report released on March 12, 2026, Dick’s reported consolidated net sales of $17.21 billion for the full year. Key highlights include:

    • Core Comparable Sales: Dick’s core brand grew comps by 4.5% for the full year, showcasing resilient demand despite a mixed macro environment.
    • Earnings Per Share (EPS): GAAP EPS stood at $9.97, impacted by roughly $600 million in integration charges from the Foot Locker deal. On a non-GAAP basis, however, the company earned $13.20 per share.
    • Margins: Gross margins in the core Dick’s business remained healthy at ~35%, though the Foot Locker banner saw a temporary 1,200 basis point compression as management liquidated aged inventory to "fresh start" the brand for 2026.
    • Capital Allocation: The company increased its annualized dividend by 3% to $5.00 per share, signaling confidence in its long-term cash flow generation.

    Leadership and Management

    The transition from Ed Stack to Lauren Hobart as CEO in 2021 marked a new era for DKS. Hobart, the company’s first female CEO, has been credited with the successful launch of "House of Sport" and the aggressive expansion into private-label apparel. Her strategy focuses on the "intersection of sport and culture," moving the brand away from a purely utilitarian equipment provider to a lifestyle destination. Ed Stack remains active as Executive Chairman, providing institutional knowledge and stability. The management team is widely regarded by analysts as one of the most disciplined in retail, particularly in the areas of inventory control and digital transformation.

    Products, Services, and Innovations

    Innovation at DKS is currently centered on "Retailtainment."

    • House of Sport: These 100,000+ square foot locations are more than stores; they are community centers. With 35 locations active and 14 more planned for 2026, they generate nearly $35 million in sales per store with superior EBITDA margins.
    • GameChanger: This digital platform now generates over $100 million in annual revenue, providing DKS with a high-margin, SaaS-like recurring revenue stream and a direct marketing channel to millions of youth sports families.
    • Vertical Brands: Private labels like DSG and Calia now account for a significant portion of sales. These brands offer 700–900 basis points higher margins than national brands, insulating the company from price wars.

    Competitive Landscape

    Dick’s currently enjoys a "moat" created by its scale and premium positioning.

    • Academy Sports and Outdoors (NASDAQ: ASO): Its closest rival, Academy, focuses on a value-oriented consumer, primarily in the South and Southeast. While ASO is more efficient on an EBITDA-per-store basis, DKS has consistently outpaced it in comparable sales growth (averaging a 10% lead over the last nine quarters).
    • Specialty Retail: Smaller players like Lululemon or local golf shops compete in specific niches, but DKS’s "one-stop-shop" model for families remains difficult to replicate.
    • Direct-to-Consumer (DTC): While brands like Nike are growing their own DTC channels, they have increasingly viewed Dick’s as a "strategic partner" rather than a competitor, often granting DKS exclusive access to premium product tiers.

    Industry and Market Trends

    The "athleisure" trend has proven to be a permanent shift in American fashion, rather than a fleeting fad. As work-from-home remains prevalent and health consciousness rises, the demand for versatile athletic apparel continues to grow. Additionally, the "outdoor economy"—encompassing camping, hiking, and pickleball—has seen sustained growth post-pandemic. Retailers that provide experiences (like the batting cages at DKS) are also outperforming those that offer purely transactional e-commerce, as consumers seek "shareable" in-person moments.

    Risks and Challenges

    Despite its dominance, DKS faces several headwinds:

    • Acquisition Integration: The Foot Locker turnaround is a massive undertaking. If DKS cannot successfully revitalize the brand or if the inventory liquidation takes longer than expected, it could drag down consolidated earnings through 2027.
    • Retail "Shrink": Organized retail crime remains a challenge for the entire industry. While DKS has invested in advanced loss prevention, inventory "shrink" continues to pressure margins.
    • Macroeconomic Pressure: Higher interest rates and persistent inflation could eventually sap the "discretionary" spending of the middle-class families that form Dick’s core customer base.

    Opportunities and Catalysts

    • House of Sport Rollout: Reaching the goal of 75–100 locations by 2027 represents a significant upside for both revenue and brand prestige.
    • Digital Growth: Continued monetization of the GameChanger platform and the expansion of the Dick's Media Network offer high-margin growth levers that are not tied to physical inventory.
    • International Expansion: While currently US-focused, management has hinted at the potential for international licensing or expansion, particularly for the Foot Locker banner which already has a global footprint.

    Investor Sentiment and Analyst Coverage

    Wall Street remains generally bullish on DKS. Following the March 2026 earnings, several firms, including Morgan Stanley and Barclays, maintained "Overweight" ratings with price targets ranging from $240 to $260. Analysts appreciate the "clean" state of the core Dick’s inventory and view the Foot Locker acquisition as a high-risk, high-reward play that leverages DKS’s best-in-class operational playbook. Retail sentiment is also positive, with the company’s loyalty program (ScoreCard) reaching record membership levels.

    Regulatory, Policy, and Geopolitical Factors

    As a major importer of apparel and footwear (largely from Southeast Asia), DKS is sensitive to trade policy and tariffs. Any escalation in trade tensions could increase the cost of goods sold. Furthermore, the company’s labor costs are influenced by minimum wage hikes in key states. From a policy perspective, the company’s proactive stance on social issues (like firearm sales) has largely insulated it from ESG-related pressures, though it remains a subject of debate in certain political circles.

    Conclusion

    Dick’s Sporting Goods has successfully navigated the "retail apocalypse" by evolving from a seller of goods into a curator of experiences. The Q4 FY2025 results highlight a company in transition—one that is willing to take a short-term hit to earnings (via the Foot Locker integration) to secure long-term dominance in the footwear market. For investors, the "House of Sport" expansion and the growth of digital assets like GameChanger provide a compelling growth narrative. While the integration of Foot Locker remains the primary "known unknown," the underlying strength of the core DKS business suggests that the company is well-positioned to remain the undisputed heavyweight champion of the sporting goods world. Investors should watch for the "back-to-school" performance in late 2026 as the ultimate litmus test for the new Foot Locker strategy.


    This content is intended for informational purposes only and is not financial advice.

  • Target Corporation (TGT): Navigating the Fiddelke Era and the New Retail Reality

    Target Corporation (TGT): Navigating the Fiddelke Era and the New Retail Reality

    Today’s date is March 10, 2026.

    Introduction

    As the retail landscape enters a new era of "Agentic Shopping" and tightening consumer discretionary budgets, few companies find themselves at a more critical crossroads than Target Corporation (NYSE: TGT). Long celebrated as the "Tar-zhay" of the American suburbs—a place where affordable chic meets everyday essentials—the Minneapolis-based retail giant is currently navigating a period of profound structural transformation. Following a multi-year slump in comparable sales and a recent leadership handoff, Target is attempting to pivot from a pandemic-era growth darling to a leaner, tech-forward omnichannel powerhouse. With the ink still dry on its fiscal 2025 earnings report, investors are weighing whether Target’s current valuation represents a "fallen angel" opportunity or a cautionary tale of a retailer caught in the middle of giants.

    Historical Background

    Target’s origins trace back to 1902 with the founding of Goodfellow Dry Goods, which later became the Dayton Company. It wasn’t until 1962 that the first Target store opened in Roseville, Minnesota, conceptualized as a discount version of Dayton’s department stores. Over the decades, Target pioneered the "cheap chic" philosophy, partnering with high-end designers like Isaac Mizrahi and Missoni to democratize luxury.

    Key transformations occurred in the mid-2010s under the leadership of Brian Cornell, who took the helm in 2014 following a massive data breach and a failed expansion into Canada. Cornell’s "stores-as-hubs" strategy, which utilized retail locations to fulfill nearly all digital orders, turned Target into an e-commerce contender and fueled a historic run of growth during the 2020-2022 period. However, the post-pandemic years brought new challenges: an inventory crisis in 2022, rising organized retail crime (shrinkage), and a shift in consumer spending from goods to services.

    Business Model

    Target operates a massive footprint of nearly 2,000 stores across the United States. Unlike competitors like Walmart (NYSE: WMT), which relies heavily on grocery for over half its revenue, Target’s business model is diversified across five core categories: Apparel & Accessories, Beauty & Household Essentials, Food & Beverage, Home Furnishings & Decor, and Hardlines (electronics and toys).

    A critical component of Target’s model is its "Owned Brands" portfolio. These private labels—such as Cat & Jack, Good & Gather, and Threshold—generate over $30 billion in annual sales, offering higher margins than national brands. Furthermore, Target has leaned into a "Flywheel" model that includes:

    • Target Circle: A loyalty program with over 100 million members.
    • Roundel: A high-margin retail media business that sells advertising space to vendors.
    • Target Circle 360: A paid membership tier launched in 2024 to compete with Amazon Prime and Walmart+.

    Stock Performance Overview

    As of March 10, 2026, Target’s stock sits at approximately $120.14, reflecting a period of significant consolidation and volatility.

    • 1-Year Performance: The stock is down approximately 9% over the last twelve months. Investors have been spooked by the executive transition and persistent margin pressure from the reimposition of tariffs in early 2026.
    • 5-Year Performance: TGT has lost roughly 35% of its value since early 2021. The stock has yet to reclaim its all-time highs above $230, as the market moved away from pandemic-boosted multiples.
    • 10-Year Performance: Long-term holders have fared better, with the stock up roughly 83.6%. This period reflects the successful turnaround led by Cornell, though much of those gains have been surrendered in the last three years.

    Financial Performance

    Target’s Fiscal Year 2025 results, reported last week, paint a picture of a company focusing on profitability over raw volume.

    • Revenue: Total revenue for FY 2025 was $104.8 billion, a 1.7% decline from the $106.6 billion recorded in FY 2024.
    • Earnings Per Share (EPS): GAAP EPS came in at $8.13, down from $8.86 the previous year.
    • Margins: Operating margins sat at 4.6%, pressured by high labor costs and inventory shrinkage, though the company noted that digital sales trends turned positive (+1.9%) in the fourth quarter.
    • Valuation: With a trailing P/E ratio around 14.7x, Target trades at a significant discount to Walmart (25x) and Costco (NASDAQ: COST) (45x), reflecting market skepticism about its near-term growth profile.

    Leadership and Management

    On February 1, 2026, Target entered a new era. Michael Fiddelke, the company’s former COO and CFO, succeeded Brian Cornell as Chief Executive Officer. Fiddelke is a 20-year veteran of the firm, known for his disciplined financial management.

    Brian Cornell has transitioned to Executive Chairman, ensuring a "guided" handoff as Fiddelke implements his "Next Chapter" strategy. This plan includes a $1 billion operating investment in 2026 aimed at store modernization and AI-driven supply chain efficiencies. The governance reputation remains high, though the board faces pressure to prove that Fiddelke can reignite top-line growth.

    Products, Services, and Innovations

    Innovation at Target currently revolves around personalization and value.

    • Target Circle 360: This paid membership has become a growth engine, seeing 30% growth in same-day delivery volume in late 2025.
    • Private Label Expansion: The 2024 launch of "Dealworthy," an ultra-low-price brand with items starting under $1, has helped Target claw back market share from dollar stores.
    • Agentic AI: In early 2026, Target integrated "Agentic Shopping" features, allowing customers to use AI personal assistants to build shopping lists and automate reorders based on predictive usage patterns.
    • Starbucks (NASDAQ: SBUX) and Ulta Beauty (NASDAQ: ULTA) Partnerships: Target continues to see high foot traffic from its "store-within-a-store" concepts, which differentiate the guest experience from a standard big-box trip.

    Competitive Landscape

    Target is currently fighting a two-front war.

    • The Value Front: Walmart has successfully capitalized on the "trade-down" trend, attracting higher-income households looking for grocery savings. Walmart’s massive scale and superior grocery pricing have allowed it to gain significant market share at Target’s expense.
    • The Convenience Front: Amazon (NASDAQ: AMZN) continues to dominate e-commerce logistics. While Target’s "stores-as-hubs" model is efficient, Amazon’s same-day delivery capabilities in major metros remain the industry benchmark.
    • Strength: Target’s competitive edge remains its "curated discovery" experience—shoppers go to Target for "the hunt," a psychological advantage that neither Amazon’s "endless aisle" nor Walmart’s utility-focused environment perfectly replicates.

    Industry and Market Trends

    The retail sector in 2026 is defined by a "K-shaped" consumer. High-income earners continue to spend on luxuries, while middle-and-lower-income households—Target’s core demographic—are pulling back on discretionary goods like home decor and electronics.
    Furthermore, Retail Media (advertising) has become essential. Target’s Roundel unit is now a multi-billion-dollar business, providing the high-margin revenue necessary to subsidize the lower margins found in the grocery and essentials aisles.

    Risks and Challenges

    • Shrinkage: Organized retail crime and inventory loss cost Target approximately $500 million in 2025. The company has been forced to lock up high-theft items and limit self-checkout, which risks hurting the guest experience.
    • Discretionary Exposure: Approximately 80% of Target's sales are in discretionary categories. In a high-interest-rate or inflationary environment, these are the first items consumers cut.
    • Tariffs: Following a 2026 Supreme Court ruling regarding trade authority, a 15% tariff on imported goods was reimposed. Given Target’s reliance on overseas manufacturing for its private labels, this poses a direct threat to gross margins.

    Opportunities and Catalysts

    • The Fiddelke Pivot: If the new CEO’s $1 billion investment in store consistency and payroll yields higher "Net Promoter Scores" and lower out-of-stock rates, Target could see a sharp rebound in comparable sales.
    • Digital Recovery: After years of digital stagnation, the Q4 2025 uptick in online sales suggests that Target’s revamped app and Circle 360 membership are finally gaining traction.
    • M&A Potential: Analysts have speculated that Target could be a candidate for a strategic acquisition of a specialized retailer (e.g., in the health and wellness space) to bolster its grocery and pharmacy offerings.

    Investor Sentiment and Analyst Coverage

    The current analyst consensus on TGT is a "Hold."

    • Bulls point to the 3.8% dividend yield and a strong Return on Invested Capital (ROIC) of 16.6%, suggesting the company is still a cash-generating machine.
    • Bears highlight the widening gap between Target and Walmart, arguing that Target is losing its relevance as a "primary" shopping destination.
    • Institutional Moves: Large institutions like Vanguard and BlackRock remain committed, holding over 80% of the float, but hedge fund activity has been net-negative over the past two quarters.

    Regulatory, Policy, and Geopolitical Factors

    • Swipe Fee Reform: Target is a major lobbyist for the Credit Card Competition Act, which seeks to lower interchange fees. A victory here could save Target hundreds of millions in annual operating expenses.
    • Labor Laws: Increasing minimum wage pressures at the state level continue to impact Target’s 400,000+ person workforce.
    • Geopolitics: Tensions in Southeast Asia and the aforementioned 2026 tariff environment have forced Target to diversify its supply chain away from China toward Vietnam and India, a costly and slow transition.

    Conclusion

    Target Corporation enters the mid-2020s as a resilient but challenged icon of American retail. The transition from Brian Cornell to Michael Fiddelke marks the end of a growth chapter and the beginning of a "stewardship and efficiency" era. While the company faces significant headwinds from a "want-constrained" consumer and rising operational costs, its robust private label brands and burgeoning retail media business provide a solid floor.

    For investors, the story of 2026 will be whether Target can bridge the gap between its discount-store reality and its department-store aspirations. Watching the performance of Target Circle 360 and the impact of the $1 billion store investment will be critical. In a market where Walmart is winning on price and Amazon is winning on speed, Target must win on experience—or risk becoming a relic of a bygone retail era.


    This content is intended for informational purposes only and is not financial advice.

  • Macy’s Rebounds: A Deep-Dive into the ‘Bold New Chapter’ and the March 2026 Stock Rally

    Macy’s Rebounds: A Deep-Dive into the ‘Bold New Chapter’ and the March 2026 Stock Rally

    On March 6, 2026, Macy’s Inc. (NYSE: M) once again became the talk of Wall Street, as its shares surged 5% following a fiscal fourth-quarter earnings report that handily beat analyst expectations. For an iconic American retailer often dismissed as a relic of the "retail apocalypse," this latest performance serves as a powerful validation of its multi-year turnaround strategy. Under the leadership of CEO Tony Spring, Macy’s has spent the last two years aggressively pruning its store portfolio, leaning into luxury nameplates like Bloomingdale’s and Bluemercury, and pivoting toward agile, small-format stores. This deep-dive examines whether the recent rally is a fleeting seasonal bump or the definitive signal of a legendary brand’s rebirth.

    Historical Background

    The story of Macy’s is the story of American consumerism. Founded in 1858 by Rowland Hussey Macy, the first store was a small dry goods shop on 14th Street and 6th Avenue in New York City. From its early "one price" policy and the introduction of the first "Santa Claus" in a department store, Macy’s pioneered the modern shopping experience. The company’s growth was defined by massive acquisitions, most notably its 1994 merger with Federated Department Stores, which brought together the Macy’s and Bloomingdale’s brands.

    Throughout the 20th century, Macy's became a cultural institution, synonymous with the Thanksgiving Day Parade and its flagship Herald Square location—one of the largest stores in the world. However, the rise of e-commerce and fast fashion in the 2010s forced the giant into a decade of defensive maneuvering, leading to the current "A Bold New Chapter" transformation.

    Business Model

    Macy’s Inc. operates as an omnichannel retailer through three primary segments:

    1. Macy’s (Core): The mass-market department store focused on apparel, home goods, and accessories.
    2. Bloomingdale’s: The high-end luxury arm, which has historically shown higher resilience and better margins than the core brand.
    3. Bluemercury: A specialty beauty and skincare chain that provides a high-touch, service-oriented clinical experience.

    Beyond merchandise, a critical part of the Macy’s business model is its Credit Card Program. The company generates significant high-margin revenue from its proprietary credit cards and co-branded Visa cards, which also drive customer loyalty. Additionally, the company is a massive real estate play; its physical footprint, particularly the Herald Square flagship, is valued at billions of dollars, providing a financial safety net and options for asset monetization.

    Stock Performance Overview

    The stock (NYSE: M) has been a rollercoaster for investors.

    • 1-Year Performance: As of March 2026, the stock has climbed approximately 45%, buoyed by successful cost-cutting and the rejection of low-ball takeover bids in 2024/2025.
    • 5-Year Performance: Shares show a gain of roughly 50%, a recovery from the depths of the COVID-19 pandemic when the retail sector was at its nadir.
    • 10-Year Performance: Over the long term, however, Macy’s still sits significantly below its 2015 peaks, reflecting the structural decline of the traditional shopping mall.

    The recent 5% rally on March 6 suggests that the market is finally pricing in a sustainable future rather than just a slow liquidation.

    Financial Performance

    The Q4 2025 earnings report (released March 2026) revealed a company that has found its footing. While net sales remained relatively flat year-over-year at $22.5 billion for the full fiscal year, the internal metrics showed significant health:

    • Earnings Per Share (EPS): Macy’s reported an adjusted EPS of $2.75, beating the consensus estimate of $2.55.
    • Inventory Management: Inventory levels were down 3% compared to the prior year, a sign of better demand forecasting and fewer clearance-heavy quarters.
    • Digital Sales: Digital penetration stabilized at 32%, with improved margins due to reduced shipping costs and better "buy online, pick up in store" (BOPIS) adoption.
    • Debt Profile: The company maintained a strong liquidity position, using excess cash flow to pay down nearly $500 million in debt over the fiscal year.

    Leadership and Management

    CEO Tony Spring has been the primary architect of this transition. Having previously led Bloomingdale’s, Spring has imported a "luxury mindset" to the broader Macy's organization. Since taking the helm in February 2024, he has replaced several legacy executives with fresh talent, including COO and CFO Thomas J. Edwards. Spring’s strategy focuses on "the best 350 stores"—referring to the high-performing locations the company is investing in while shuttering 150 underperforming mall-based sites. His reputation for operational discipline and a focus on "newness" has earned him high marks from institutional investors.

    Products, Services, and Innovations

    Macy’s is moving away from the "one-size-fits-all" department store. Key innovations include:

    • Small-Format Stores: Known as "Market by Macy's" and "Bloomie's," these 30,000 to 50,000-square-foot shops are located in strip centers rather than malls. They offer a curated selection and are cheaper to operate.
    • AI-Driven Merchandising: The company now uses predictive analytics to stock local stores based on neighborhood-specific data, reducing the need for aggressive markdowns.
    • Media Network: Macy’s has expanded its retail media network, allowing brand partners to advertise directly to Macy’s massive customer database, creating a new, high-margin revenue stream.

    Competitive Landscape

    Macy’s sits in a crowded middle ground. Its primary rivals include:

    • Luxury Tier: Nordstrom (NYSE: JWN) competes directly with Bloomingdale’s. Macy’s currently holds an edge in beauty via Bluemercury.
    • Mid-Tier: Kohl’s (NYSE: KSS) and Target (NYSE: TGT) compete for the value-conscious apparel shopper.
    • Off-Price: The TJX Companies (NYSE: TJX) continues to siphon off customers looking for bargains.
    • E-commerce: Amazon (NASDAQ: AMZN) remains the overarching threat to all physical retail.

    Macy's strength lies in its "exclusive brands" (private labels like INC and Charter Club) and its dominant position in the "Big Three" categories: Beauty, Shoes, and Handbags.

    Industry and Market Trends

    The retail industry in 2026 is defined by a "K-shaped" recovery. High-income consumers continue to spend on luxury (benefiting Bloomingdale’s), while middle-income consumers are increasingly price-sensitive. Macy’s "A Bold New Chapter" strategy is a direct response to this: closing stores in dying malls while opening smaller shops in affluent suburban pockets where the customers actually live and shop daily.

    Risks and Challenges

    Despite the rally, significant risks remain:

    • Discretionary Spending: High interest rates and a cooling labor market could dampen consumer appetite for non-essential apparel and home goods.
    • Real Estate Execution: The plan to close 150 stores is complex. If Macy's cannot exit these leases or sell the properties profitably, it could weigh on the balance sheet.
    • Brand Fatigue: Rejuvenating the "Macy's" brand for Gen Z and Millennials remains an uphill battle against faster, trendier competitors.

    Opportunities and Catalysts

    • Asset Monetization: There is persistent speculation regarding the potential spin-off of the e-commerce business or the monetization of the Herald Square real estate.
    • Luxury Expansion: Scaling the "Bloomie's" small-format concept into high-income markets (like Austin, Nashville, and Scottsdale) offers high growth potential.
    • Private Label Refresh: Macy's is currently revamping its private labels to achieve better margins and unique differentiation.

    Investor Sentiment and Analyst Coverage

    Analyst sentiment has turned "cautiously bullish" following the March 2026 results. Several firms, including J.P. Morgan and Morgan Stanley, raised their price targets to the $24–$26 range. Institutional ownership remains high, with names like Vanguard and BlackRock holding significant stakes. Retail sentiment on social platforms has also seen a shift from "short-sell" candidates to "value-recovery" stories, particularly as the dividend yield remains attractive for income investors.

    Regulatory, Policy, and Geopolitical Factors

    Macy’s is sensitive to several macro-regulatory issues:

    • Labor Laws: As a massive employer, increases in the federal or state minimum wage directly impact operating margins.
    • Trade Policy: Tariffs on textiles and consumer electronics from overseas suppliers can squeeze margins, though Macy’s has diversified its supply chain significantly away from China in recent years.
    • ESG Compliance: Increasingly, institutional investors are pressuring Macy’s to meet aggressive carbon-neutral goals across its vast logistics and physical store network.

    Conclusion

    The 5% rally on March 6, 2026, is more than just a reaction to a good quarter; it is a sign that Macy’s Inc. is successfully navigating the transition from a mall-dependent giant to an agile, omnichannel retail player. By focusing on its "Go-Forward" stores, expanding its luxury footprint through Bloomingdale’s, and leveraging small-format locations, Macy’s has proven it still has a place in the modern retail landscape. Investors should remain watchful of broader macroeconomic trends, but for now, the "Bold New Chapter" appears to be writing a successful comeback story.


    This content is intended for informational purposes only and is not financial advice.

  • The Treasure Hunt King: A Deep-Dive into TJX Companies (TJX) for 2026

    The Treasure Hunt King: A Deep-Dive into TJX Companies (TJX) for 2026

    As of March 6, 2026, the retail landscape continues to grapple with shifting consumer behaviors and macroeconomic fluctuations. Yet, one name consistently stands out as a beacon of resilience: The TJX Companies, Inc. (NYSE: TJX). Known for its "treasure hunt" shopping experience, TJX has defied the "retail apocalypse" narrative that claimed many of its department store peers. Following a landmark Q1 2024 earnings beat that signaled a massive shift in consumer "trading down," the company has maintained an upward trajectory, solidifying its position as the undisputed king of off-price retail. With its shares trading near all-time highs and a global footprint expanding into new markets, TJX remains a focal point for institutional and retail investors alike.

    Historical Background

    The TJX story began in 1976 when Bernard Cammarata, a former merchandiser, was recruited by Zayre Corp. to launch a new off-price brand. The result was T.J. Maxx, which opened its first two stores in Auburn and Worcester, Massachusetts. The concept was revolutionary: offer name-brand apparel and home fashions at prices significantly lower than department stores by buying opportunistic "broken" assortments.

    The company’s most transformative moment came in 1995 with the $606 million acquisition of Marshalls, its primary competitor. This merger created the Marmaxx division and cemented TJX's dominance in the U.S. market. Over the following decades, the company diversified into home décor with HomeGoods (1992) and expanded internationally with the launch of T.K. Maxx in the UK and Ireland (1994), and the acquisition of Winners in Canada. Today, TJX is a Fortune 100 company operating over 5,000 stores across nine countries.

    Business Model

    TJX operates on a high-velocity, off-price business model that prioritizes inventory turnover and opportunistic sourcing. Unlike traditional retailers that plan inventory cycles 6 to 12 months in advance, TJX’s team of over 1,300 buyers works year-round with a network of 21,000+ vendors to purchase excess merchandise.

    Core Segments:

    • Marmaxx (U.S.): Comprising T.J. Maxx and Marshalls, this is the company’s largest revenue driver, focusing on apparel, accessories, and footwear.
    • HomeGoods (U.S.): A specialized off-price home fashions retailer that has seen explosive growth in the post-pandemic "nesting" era.
    • TJX Canada: Includes Winners, HomeSense, and Marshalls.
    • TJX International: Operations in Europe (UK, Ireland, Germany, Poland, Austria, Netherlands) and Australia under the T.K. Maxx and HomeSense banners.

    The "Treasure Hunt" factor is the engine of the business. By stocking a constantly changing assortment of brands and products, TJX creates a sense of urgency. Consumers are conditioned to buy an item immediately, knowing it may not be there tomorrow—a psychological driver that creates high foot traffic and minimizes the need for deep markdowns.

    Stock Performance Overview

    TJX has been a stellar performer for long-term shareholders. As of March 6, 2026, the stock has significantly outperformed the S&P 500 and the broader XRT Retail ETF.

    • 1-Year Performance: The stock is up approximately 32%, fueled by consistent margin expansion and robust comparable store sales growth.
    • 5-Year Performance: Shares have climbed nearly 176%, demonstrating the stock’s defensive qualities during the high-inflation and rising interest rate environments of 2022-2024.
    • 10-Year Performance: Up a staggering 391%, the stock reflects the successful execution of its global store expansion strategy and its emergence as a "dividend aristocrat" in all but name, having raised dividends for 28 of the last 29 years.

    Financial Performance

    The fiscal year ending in early 2024 (FY25 for the company) was a turning point. In May 2024, TJX reported a Q1 earnings beat that exceeded even the most optimistic analyst estimates. The company posted Diluted Earnings Per Share (EPS) of $0.93—a massive jump from $0.76 the previous year—on net sales of $12.48 billion.

    As of the current March 2026 reporting cycle, the momentum has continued:

    • Net Sales: Estimated to hit $60.4 billion for the most recent fiscal year.
    • Comparable Store Sales: Consistently trending in the 4% to 5% range, driven largely by increased customer traffic rather than just price increases.
    • Profitability: Pretax profit margins have expanded to 12.2%, aided by lower freight costs and optimized supply chain logistics.
    • Valuation: The stock currently trades at a forward P/E of approximately 32x, a premium to its historical average but reflective of its "safe haven" status in the retail sector.

    Leadership and Management

    TJX is led by Ernie Herrman, who has served as CEO since 2016. A TJX veteran since 1989, Herrman is widely described as a "merchant’s CEO." His strategy has been one of disciplined growth and a "stores-first" approach. Notably, Herrman has been cautious with e-commerce, maintaining that the core of TJX's profitability lies in the physical "treasure hunt" experience rather than the low-margin logistics of online shipping.

    The leadership team is praised for its stability and deep bench of merchandising talent. The company’s governance is generally viewed as top-tier, with a board that emphasizes long-term value creation and a culture that prioritizes relationships with its vast vendor network.

    Products, Services, and Innovations

    While TJX does not invest in R&D in the way a technology firm does, its innovation lies in its operational logistics and sourcing algorithms. The company has perfected the "open-to-buy" strategy, allowing it to pivot instantly to categories that are trending.

    In recent years, TJX has leaned into the "Home" category, expanding the HomeGoods and HomeSense brands globally. They have also introduced "The Runway" within select T.J. Maxx stores—a high-end designer section that offers luxury labels like Gucci and Prada at discount prices, successfully attracting a more affluent demographic.

    Competitive Landscape

    TJX remains the "big brother" of the off-price retail space, with a market capitalization and store count nearly three times that of its nearest rival.

    • Ross Stores (NASDAQ: ROST): The primary competitor, focusing on a slightly more budget-conscious consumer. Ross has maintained strong margins but lacks the international diversification of TJX.
    • Burlington Stores (NYSE: BURL): Formerly Burlington Coat Factory, this company has undergone a major transformation to mimic the TJX model, focusing on smaller store formats and improved inventory turnover.
    • Department Stores: Players like Macy’s (NYSE: M) and Kohl’s (NYSE: KSS) are increasingly viewed as "market share donors" to TJX. As traditional department stores close locations, TJX often swoops in to capture the displaced traffic.

    Industry and Market Trends

    The current macro environment favors off-price retail. Two primary trends are driving this:

    1. The "Trade-Down" Effect: Persistently high living costs have forced middle- and high-income shoppers to seek value. TJX has successfully branded itself as a "smart" way to shop for luxury, removing the stigma once associated with discount stores.
    2. Inventory Sourcing: As traditional retailers struggle with inventory management and over-ordering, the supply of high-quality, branded goods available for TJX to purchase at a discount has increased.

    Risks and Challenges

    Despite its dominance, TJX is not without risks:

    • Valuation Compression: Trading at a 32x forward P/E, the stock is priced for perfection. Any deceleration in comparable store sales could lead to a significant valuation reset.
    • Labor Costs: As a labor-intensive brick-and-mortar business, rising minimum wages across the U.S. and Europe continue to put pressure on operating margins.
    • Inventory Volatility: While inventory gluts benefit TJX, a sudden "clean up" of the retail supply chain could reduce the availability of premium brands.
    • Tariff Exposure: Though TJX buys mostly through vendors rather than direct importing, new global trade policies in 2025/2026 could eventually trickle down into higher vendor pricing.

    Opportunities and Catalysts

    • Global Expansion: Management has identified a long-term potential for 7,000 stores globally. Recent successes in Spain and Australia suggest that the off-price model translates well across different cultures.
    • High-Income Retention: A key catalyst will be whether TJX can retain the affluent shoppers who started "trading down" during the inflation of 2023-2024.
    • Sierra Trading Post: TJX’s outdoor and activewear brand, Sierra, represents a massive untapped growth lever in the lucrative sporting goods space.

    Investor Sentiment and Analyst Coverage

    Wall Street remains overwhelmingly bullish on TJX. Most analysts maintain "Buy" or "Overweight" ratings, citing the company's best-in-class execution. Institutional ownership remains high, with major funds like Vanguard and BlackRock holding significant positions. Among retail investors, TJX is favored for its steady dividend growth and its reputation as a "boring but beautiful" compounder.

    Regulatory, Policy, and Geopolitical Factors

    TJX must navigate a complex web of international regulations.

    • ESG Compliance: The company is under increasing pressure to ensure supply chain transparency, particularly regarding labor practices in the factories of the brands it sells.
    • Geopolitical Stability: With a significant presence in Europe, TJX is sensitive to economic downturns in the UK and Germany, as well as currency fluctuations (the Euro and British Pound) which can impact reported earnings.

    Conclusion

    The TJX Companies, Inc. is a masterclass in retail operational excellence. By weaponizing the unpredictability of the global supply chain, TJX has turned "excess inventory" into a multibillion-dollar profit engine. The company’s Q1 2024 earnings beat was not a fluke, but rather a validation of a business model that thrives when consumers prioritize value.

    While the stock’s current valuation suggests high expectations, the company’s history of conservative guidance and consistent delivery makes it a formidable component of any diversified portfolio. Investors should keep a close eye on the HomeGoods division’s margins and the pace of international store openings as primary indicators of the next leg of growth. For now, TJX remains the undisputed leader of the "treasure hunt."


    This content is intended for informational purposes only and is not financial advice. Today's date: 3/6/2026.

  • Ross Stores (ROST) Deep-Dive: Decoding the 8% Surge and the Future of the Treasure Hunt

    Ross Stores (ROST) Deep-Dive: Decoding the 8% Surge and the Future of the Treasure Hunt

    On March 5, 2026, the retail sector witnessed a definitive signal of consumer resilience as Ross Stores, Inc. (NASDAQ: ROST) saw its stock price surge by over 8%, reaching a new 52-week high of $213.52. This rally followed a "blowout" fourth-quarter earnings report for the 2025 fiscal year, characterized by a significant beat on both the top and bottom lines. In an era where e-commerce giants and digital storefronts dominate the headlines, Ross Stores continues to prove that the "treasure hunt" physical retail model is not only surviving but thriving. With a newly installed leadership team and an aggressive expansion strategy, Ross has positioned itself as the premier destination for value-conscious shoppers across the United States.

    Historical Background

    The origins of Ross Stores trace back to 1950, when Morris Ross opened the first junior department store in San Bruno, California. However, the modern iteration of the company began in 1982, when a group of investors—including Stuart Moldaw and Bill Isackson—acquired the six-store chain and pivoted to the "off-price" retail model. This transition was inspired by the success of early pioneers like Marshalls.

    Throughout the 1990s and 2000s, Ross expanded rapidly across the Sunbelt and Western United States, focusing on a "no-frills" shopping experience that prioritized deep discounts over aesthetic flair. By the 2010s, Ross had solidified its place as the second-largest off-price retailer in the nation. Key milestones include the 2004 launch of dd’s DISCOUNTS, a sister chain targeting lower-income households, and the company's consistent ability to navigate economic downturns, such as the 2008 financial crisis, by capturing the "trade-down" consumer market.

    Business Model

    Ross Stores operates under a lean, opportunistic business model. Unlike traditional department stores that buy merchandise months in advance, Ross buyers capitalize on overstocks, cancelled orders, and closeouts from manufacturers and other retailers. This "opportunistic buying" allows Ross to offer brand-name apparel and home fashion at 20% to 60% below department store regular prices.

    The company segments its business primarily through two banners:

    • Ross Dress for Less: The core brand, focused on middle-income families looking for high-quality brands at a discount.
    • dd’s DISCOUNTS: A more localized, value-driven format that caters to lower-income demographics with even deeper price cuts.

    The "treasure hunt" aspect—where inventory changes daily and items are not replenished—creates a sense of urgency for shoppers, driving high foot traffic and frequent return visits. Crucially, Ross maintains a very limited e-commerce presence, focusing instead on minimizing the logistical costs associated with online shipping and returns.

    Stock Performance Overview

    Ross Stores has been a reliable "compounder" for long-term investors.

    • 1-Year Performance: Including the 8% surge on March 5, 2026, the stock has outperformed the S&P 500 Retail Index by nearly 15% over the past twelve months.
    • 5-Year Performance: Since early 2021, ROST has seen steady appreciation, benefiting from the post-pandemic recovery and the inflationary environment of 2022-2024, which drove more shoppers toward value retail.
    • 10-Year Performance: Over the past decade, Ross has delivered a total return (including dividends) that significantly exceeds the broader market, fueled by consistent store count growth and disciplined share buyback programs.

    Financial Performance

    The earnings report released on March 3, 2026, for the quarter ended January 31, 2026, was a watershed moment for the company.

    • Earnings Per Share (EPS): Ross reported $2.00 per share, smashing the analyst consensus of $1.90.
    • Revenue: Total sales for the quarter hit $6.64 billion, a 12.2% year-over-year increase.
    • Comparable Store Sales: A vital metric in retail, "comps" grew by a staggering 9%, more than double the 3-4% growth analysts had projected.
    • Margins: Merchandise margins improved by 10 basis points, despite increased labor costs, thanks to better inventory management.
    • Guidance: For fiscal 2026, management projected an EPS range of $7.02 to $7.36, signaling continued confidence in the current consumer spending environment.

    Leadership and Management

    In February 2025, Ross Stores underwent a significant leadership transition. James (Jim) Conroy, formerly the CEO of Boot Barn, took the helm as CEO, succeeding long-time veteran Barbara Rentler. As of early 2026, Conroy’s tenure is being hailed as a successful modernization phase. While Rentler—who remains a Senior Advisor through 2027—perfected the "merchandising secret sauce," Conroy has been credited with enhancing the company's digital marketing and social media presence (particularly on TikTok and Meta platforms) to attract Gen Z and Millennial shoppers.

    Furthermore, the board saw a change in January 2026, with K. Gunnar Bjorklund becoming Board Chair, replacing Michael Balmuth. This fresh leadership team is tasked with balancing the company’s traditional off-price discipline with the need for digital-era marketing.

    Products, Services, and Innovations

    While Ross sells a wide variety of goods—from designer shoes to kitchenware—their primary innovation lies in their supply chain. The "Packaway" strategy is a cornerstone of their edge: Ross buys excess merchandise during one season and holds it in warehouses to sell in a later season, allowing them to offer premium brands at times when they are no longer available in traditional stores.

    In 2025 and early 2026, Ross also began testing localized merchandise assortments, using advanced data analytics to tailor store inventory to specific regional demographics. This "hyper-localization" has been a key driver behind the 9% comparable store sales growth.

    Competitive Landscape

    Ross competes in a crowded retail field but holds a dominant niche.

    • The TJX Companies (NYSE: TJX): The clear market leader. TJX (TJ Maxx, Marshalls, HomeGoods) has a much larger international footprint and higher revenue, but Ross often maintains better operating margins due to its more frugal store formats.
    • Burlington Stores (NYSE: BURL): The third-largest player. Burlington has been mimicking Ross's "smaller store" strategy with some success, though it still lags in total market share.
    • Department Stores: Companies like Macy’s (NYSE: M) and Kohl’s (NYSE: KSS) have struggled as Ross captures their traditional customers through a more compelling value proposition.

    Currently, analysts estimate the off-price market share is roughly 68% for TJX, 22% for Ross, and 10% for Burlington.

    Industry and Market Trends

    The "Goldilocks" environment for off-price retail has persisted into 2026. Two major trends are at play:

    1. The Trade-Down Effect: High-income earners (households making $100k+) are increasingly shopping at Ross to offset high costs of living, a trend that began during the 2022 inflation spike and has become permanent behavior.
    2. The "Pump-to-Pocket" Boost: Cooling gasoline prices in early 2026 have acted as an immediate "tax cut" for Ross’s core low-to-middle income customer base, freeing up discretionary income for apparel and home decor.

    Risks and Challenges

    Despite the recent success, Ross faces several headwinds:

    • Inventory Shrink: Like many physical retailers, "shrink" (theft and loss) remains a persistent drag on margins, particularly in high-density urban markets.
    • Labor Costs: Minimum wage increases across various states have pressured operating expenses.
    • Tariffs: While Ross is adept at supply chain management, any significant escalation in trade tariffs on goods from Southeast Asia or China could impact the initial "cost of goods sold" before they reach the packaway stage.

    Opportunities and Catalysts

    Ross is far from its ceiling.

    • Store Expansion: The company has a long-term goal of 3,600 stores (up from 2,267 at the end of 2025). In 2026 alone, it plans to open 110 new locations.
    • New Markets: Recent entries into the New York Metro area and Puerto Rico have exceeded performance expectations, proving the brand travels well into high-cost and island territories.
    • dd’s DISCOUNTS Acceleration: Management is re-accelerating the rollout of dd’s DISCOUNTS, which serves a demographic that is currently underserved by traditional retail.

    Investor Sentiment and Analyst Coverage

    Wall Street is currently "Overweight" on ROST. Following the March 2026 earnings beat, major firms including Citigroup and Telsey Advisory Group raised their price targets to $240. Institutional investors, including Vanguard and BlackRock, remain heavily invested, drawn by the company’s aggressive capital return policy. In March 2026, Ross announced a 10% dividend increase and a new $2.55 billion share repurchase program for the 2026-2027 period.

    Regulatory, Policy, and Geopolitical Factors

    Ross is subject to various labor and trade regulations. The company’s focus on the U.S. market (with no significant international presence) insulates it from direct currency fluctuations but leaves it vulnerable to domestic policy shifts regarding retail labor laws and import duties. In 2025, the company successfully lobbied for more stringent organized retail crime legislation, which has begun to show early signs of mitigating the "shrink" issue in certain jurisdictions.

    Conclusion

    The 8% stock surge on March 5, 2026, is more than just a reaction to a single earnings beat; it is a validation of the off-price model's durability. Ross Stores, Inc. has navigated a leadership transition with grace, modernized its marketing for a new generation, and continues to find white space for physical growth in an increasingly digital world. While risks like retail theft and labor costs persist, the company’s "Amazon-proof" treasure hunt experience and disciplined financial management make it a standout in the retail sector. Investors should keep a close eye on the execution of the 110-store expansion plan in 2026, which will be the ultimate litmus test for the new CEO's growth ambitions.


    This content is intended for informational purposes only and is not financial advice.

  • The Orange Giant’s Pivot: A Deep Dive into Home Depot (HD) in 2026

    The Orange Giant’s Pivot: A Deep Dive into Home Depot (HD) in 2026

    As of February 24, 2026, The Home Depot, Inc. (NYSE: HD) stands at a critical juncture in its nearly 50-year history. Known globally for its cavernous "orange box" warehouses and the signature orange aprons of its associates, the company is no longer just a retailer; it is a sprawling logistics and professional supply powerhouse. In an era defined by fluctuating mortgage rates and a "locked-in" housing market, Home Depot has aggressively pivoted to capture the "Complex Pro" customer—the contractors, roofers, and remodelers who drive the lion's share of high-value industry spend.

    This deep dive explores how the company’s recent Q4 2025 earnings, its continued commitment to dividend growth, and its massive strategic acquisitions have positioned it to weather a cooling 2026 consumer spending environment.

    Historical Background

    Founded in 1978 by Bernie Marcus and Arthur Blank, along with investment banker Ken Langone and merchandising guru Pat Farrah, Home Depot revolutionized the home improvement industry. The first two stores opened in Atlanta, Georgia, with a simple but radical premise: warehouse-sized stores stocked with a vast array of products at low prices, staffed by knowledgeable associates.

    The company went public in 1981 and spent the next three decades in an aggressive expansion phase, eventually displacing Sears and local hardware stores as the dominant force in American home improvement. Over the years, Home Depot has survived multiple economic cycles, from the housing boom of the early 2000s to the devastating 2008 financial crisis, emerging each time with a more refined supply chain and a deeper focus on the professional trade.

    Business Model

    Home Depot operates a high-volume, low-margin retail and distribution model. Its revenue is derived from three primary streams:

    1. DIY (Do-It-Yourself): Individual homeowners purchasing materials for small projects and maintenance.
    2. DIFM (Do-It-For-Me): Customers who purchase materials but hire Home Depot or third-party pros to perform the installation.
    3. The Pro: Professional contractors, renovators, and property managers.

    While the DIY segment traditionally provided high foot traffic, the Pro segment now accounts for approximately 50% of revenue despite representing a small fraction of the total customer base. Home Depot’s "interconnected retail" strategy allows customers to browse online and pick up in-store, or have heavy materials delivered directly to a job site—a critical advantage for time-sensitive professionals.

    Stock Performance Overview

    As of late February 2026, Home Depot’s stock performance reflects the broader uncertainty in the U.S. housing market:

    • 1-Year Performance: The stock has seen a slight decline of approximately 1.5% to 2.3% over the past year. Investors have been cautious as high interest rates cooled discretionary home spending.
    • 5-Year Performance: HD has delivered a total return of roughly 62% (inclusive of dividends). While solid, this has trailed the S&P 500's broader rally, which saw near 90% gains in the same period.
    • 10-Year Performance: The long-term thesis remains intact, with a staggering 290% total return over the last decade, significantly outperforming inflation and many of its retail peers.

    Financial Performance

    Home Depot’s Q4 and Fiscal Year 2025 results, released on February 24, 2026, show a company managing a "normalization" period with discipline:

    • Sales Growth: Q4 sales reached $38.2 billion, a 3.8% decrease year-over-year. This drop was largely attributed to a "calendar shift," as the previous year included an extra 14th week.
    • Comparable Sales: Underlying demand remains positive, with comparable sales rising a modest 0.4% globally.
    • Earnings: Full-year 2025 net earnings reached $14.2 billion, with a diluted EPS of $14.23.
    • Operating Margins: Held steady at approximately 12.96%, showcasing the company’s ability to control costs even as commodity prices (like lumber) fluctuated and labor costs remained elevated.

    Leadership and Management

    CEO Ted Decker, who took the helm in 2022, has been the architect of the "Supply House" strategy. Decker’s leadership is characterized by a "Pro-first" mentality. Unlike previous regimes that focused purely on retail footprint, Decker has prioritized "wallet share" among professionals.

    The management team is widely respected for its operational excellence and its "inverted pyramid" philosophy, which places the frontline associates at the top of the organizational importance. This governance style has helped Home Depot maintain higher-than-average retention in a tight labor market.

    Products, Services, and Innovations

    Innovation at Home Depot is currently focused on the Pro Ecosystem:

    • Distribution Centers: The company has opened massive flatbed distribution centers (FDCs) designed specifically to deliver bulky items like lumber and roofing directly to job sites, bypassing the retail store entirely.
    • Digital Integration: The HD Pro app now includes advanced order tracking, tiered pricing, and inventory management tools that integrate directly into a contractor’s workflow.
    • Specialized Offerings: Through its acquisitions of SRS Distribution and GMS Inc., Home Depot has entered specialized verticals like roofing, pool supplies, and interior framing (drywall/ceilings), offering a one-stop-shop that traditional retailers cannot match.

    Competitive Landscape

    Home Depot remains the undisputed leader in the home improvement space, but the competition is evolving:

    • Lowe’s Companies, Inc. (NYSE: LOW): The primary rival. While Lowe’s has historically been more "DIY-focused," it has recently attempted to mirror HD’s Pro strategy. However, HD still maintains a significant lead in Pro market share (51% vs. ~30%).
    • Floor & Decor Holdings (NYSE: FND): A fast-growing specialist in hard-surface flooring that competes for high-ticket renovation projects.
    • Amazon.com (NASDAQ: AMZN): While Amazon dominates small-parcel goods, Home Depot’s "moat" lies in the "big and bulky" category—items that are expensive or impossible to ship via standard parcel carriers.

    Industry and Market Trends

    The home improvement industry in 2026 is grappling with the "Lock-in Effect." With mortgage rates remaining stubbornly around 6.3%, many homeowners are choosing to stay in their current homes rather than trade up. This has led to a shift in spending:

    • Essential over Discretionary: Consumers are prioritizing essential repairs (roofing, HVAC, plumbing) over "dream kitchen" remodels.
    • Aging Housing Stock: The median age of U.S. homes is now over 40 years, creating a structural tailwind for maintenance and repair demand that is largely independent of the broader economy.

    Risks and Challenges

    • Macroeconomic Sensitivity: Home Depot is highly sensitive to the health of the housing market. If interest rates remain elevated for longer than expected, big-ticket spending may continue to stall.
    • Commodity Volatility: Sharp fluctuations in the price of lumber and copper can lead to "deflationary" sales pressure, where the company sells the same volume of goods for fewer dollars.
    • Labor Market: Ongoing shortages of skilled tradespeople (plumbers, electricians) can slow down the completion of projects, indirectly reducing demand for materials.

    Opportunities and Catalysts

    • M&A Synergies: The full integration of SRS Distribution (purchased for $18.25 billion) and GMS Inc. is expected to yield significant cost savings and cross-selling opportunities in 2026.
    • Total Addressable Market (TAM): Home Depot estimates its TAM at over $1.1 trillion. With current annual sales of $164.7 billion, there is still immense room for consolidation in a fragmented market.
    • Dividend Growth: The February 2026 dividend increase to $2.33 per quarter ($9.32 annually) marks the 15th consecutive year of increases, appealing to income-seeking investors.

    Investor Sentiment and Analyst Coverage

    Wall Street sentiment toward Home Depot remains "Cautiously Optimistic." Institutional ownership is high, with firms like Vanguard and BlackRock holding significant stakes.

    • Analyst Ratings: Most analysts maintain a "Hold" or "Buy" rating, viewing the stock as a "core" holding for any diversified portfolio.
    • Valuation: Trading at a forward P/E ratio of approximately 25.2x, the stock is considered fairly valued—neither a bargain nor excessively expensive given its quality and dividend yield of ~2.47%.

    Regulatory, Policy, and Geopolitical Factors

    Regulatory risks for Home Depot include:

    • Trade Policy: As a major importer, any increase in tariffs on steel, aluminum, or Chinese-manufactured goods could squeeze margins.
    • Environmental Regulations: Increasing pressure to provide sustainable timber and energy-efficient appliances (like heat pumps) requires constant supply chain adjustments.
    • Housing Policy: Any government incentives for first-time homebuyers or renovation tax credits could act as a significant catalyst for sales.

    Conclusion

    As we navigate 2026, The Home Depot (NYSE: HD) remains a titan of American retail, but its future success is increasingly tied to the professional contractor. The company’s Q4 2025 results demonstrate a steady hand in a cooling market, and its aggressive M&A strategy suggests it is not content simply to wait for lower interest rates.

    For investors, the central question is whether the "Complex Pro" strategy can fully offset the softness in DIY discretionary spending. While the short-term outlook remains muted by macro headwinds, the long-term fundamentals—driven by an aging housing stock and a dominant market position—suggest that Home Depot remains one of the most resilient compounders in the consumer discretionary sector.


    This content is intended for informational purposes only and is not financial advice.